

The flow of business within a company or the flow of processing in a system is often summarized in a diagram called a “flowchart.” This flowchart becomes an important presence in the business field and system development field.
However, many people may not be familiar with the types and symbols used. This article provides an overview of flowcharts, how to write them, types, how to use symbols, etc. If you have the opportunity to view or draw flowcharts in your work, please refer to this article.
What is a flowchart?
A flowchart is a diagram that summarizes the flow of business and various processes in a diagram that clearly states it visually. Flowcharts use common fixed symbols (shapes) depending on the processing to be performed, branching conditions, etc.
This allows anyone who understands how to read a flowchart to easily understand the flow of business and processing just by looking at it. Flowcharts can be used to represent various levels of information, from simple business procedures to complex systems. It is also easy to modify and improve, and multiple people can work together to create and analyze it.
History about flowcharts
The origin of flowcharts is said to be the “flow process chart,” developed by the American production engineers Mr. and Mrs. Gilbreth in the 1920s. Flow process charts were introduced at the American Society of Mechanical Engineers (ASME) in 1921.
In the 1930s, industrial engineer Erlan H. Mojensen, who advocated “simplification of work”, used flow process charts in presentations at conferences on the topic of improving the efficiency of his company’s operations.
In the 1940s, Ben S. Graham, director of Standard Register Industrial, adopted flow process diagrams for information processing, and in 1947, the American Society of Mechanical Engineers adopted this symbol system for flow process charts. I started.
Since the late 1940s, flowcharts have become a popular tool in the programming world. Since then, flowcharts have come to be used in programming and business process construction in various industries.
What is the role and purpose of a flowchart?
Flowcharts have the following roles and purposes:
By creating a flowchart, you can visually understand the flow of tasks and tasks. Therefore, if you want to check the flow of business or work, you can do so right away by looking at the flowchart.
In addition, since the work flow can be shared between those involved in the business, communication between them becomes smoother. When identifying problems in current operations, analyzing flowcharts can reveal delays or errors in specific steps or procedures. By using flowcharts, you can quickly discover problems and consider improvement measures.
In the field of systems development, it can help engineers and programmers understand the logic flow of a system.
Symbols used in flowcharts
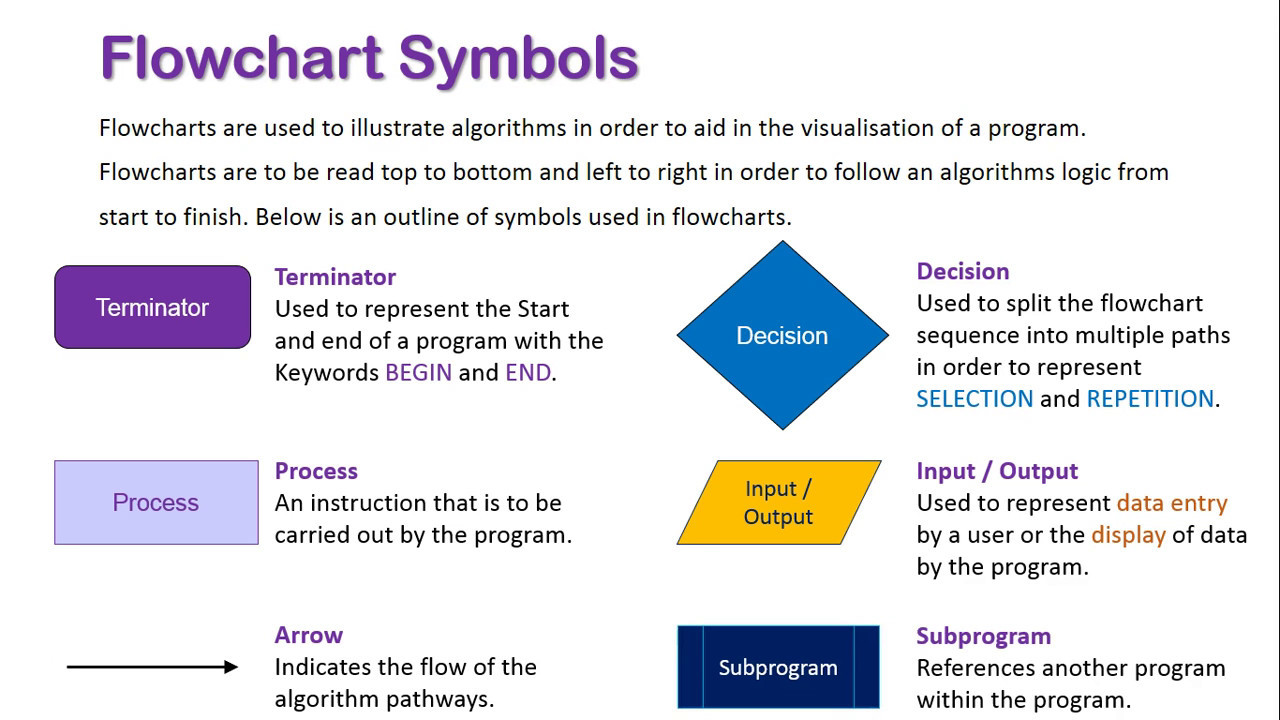
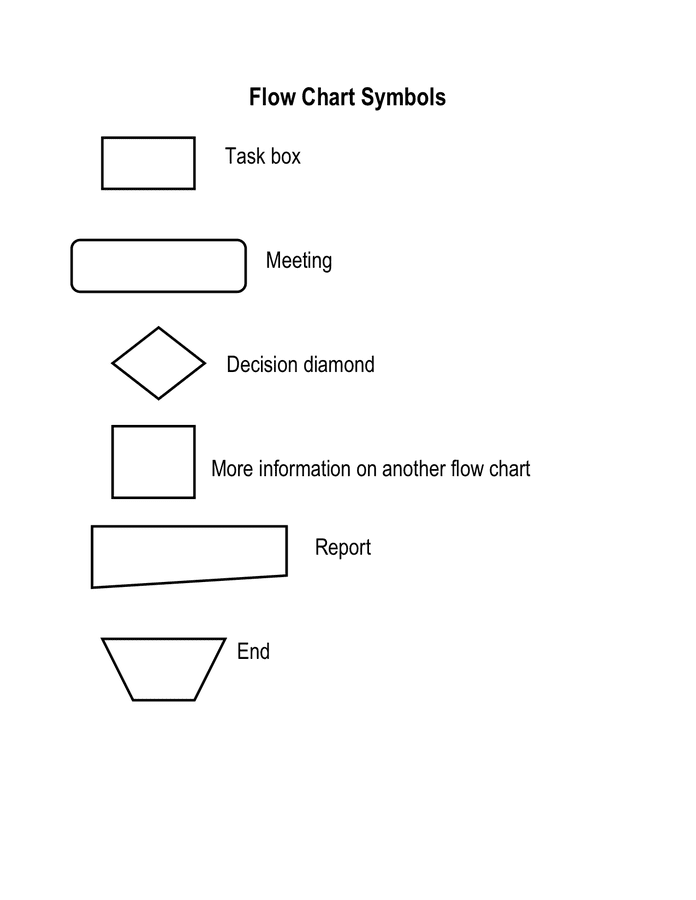
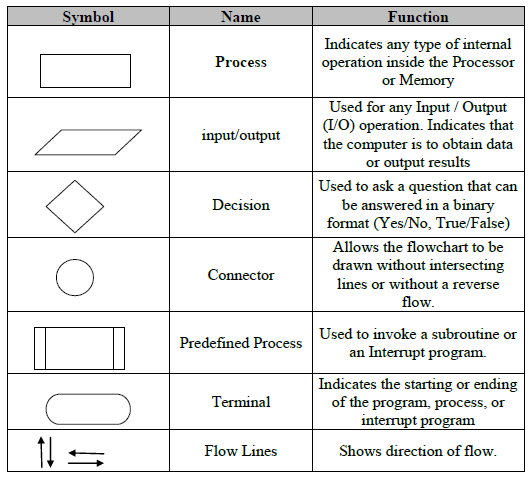
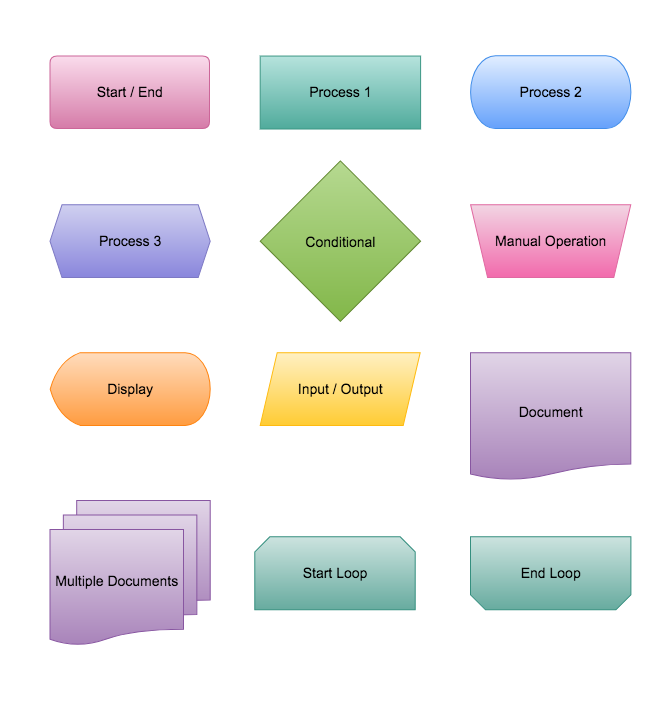
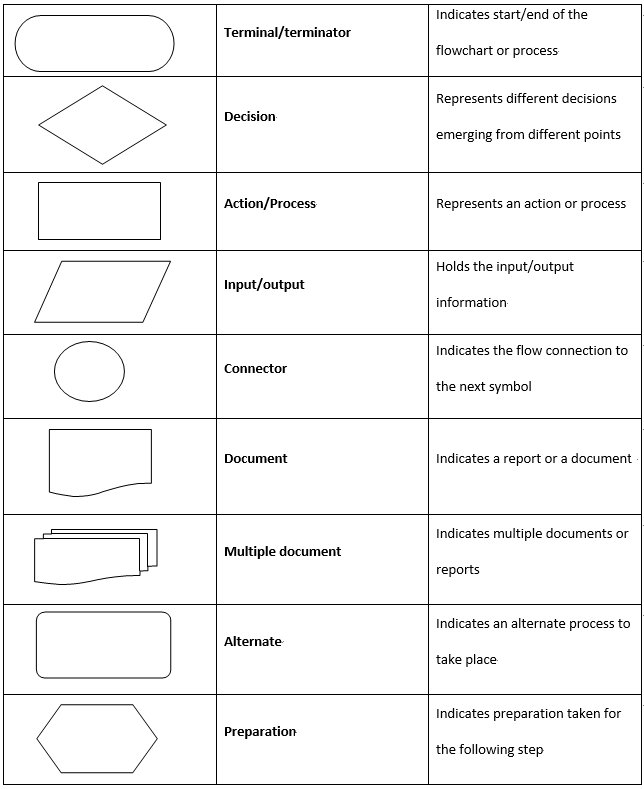
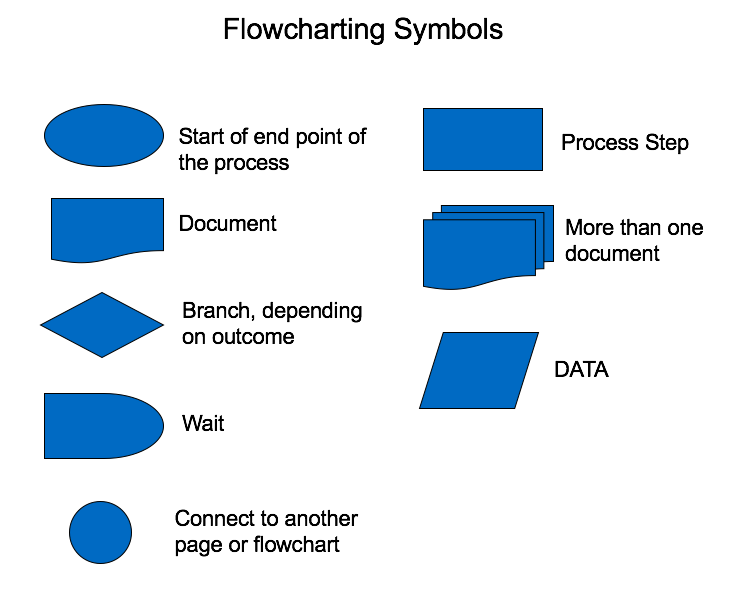
The following symbols are mainly used in flowcharts.
By combining these symbols, you can visually express the flow of a series of processes in an easy-to-understand manner. In addition to the above, there are many other symbols such as “comment”, “manual operation”, and “delay”.
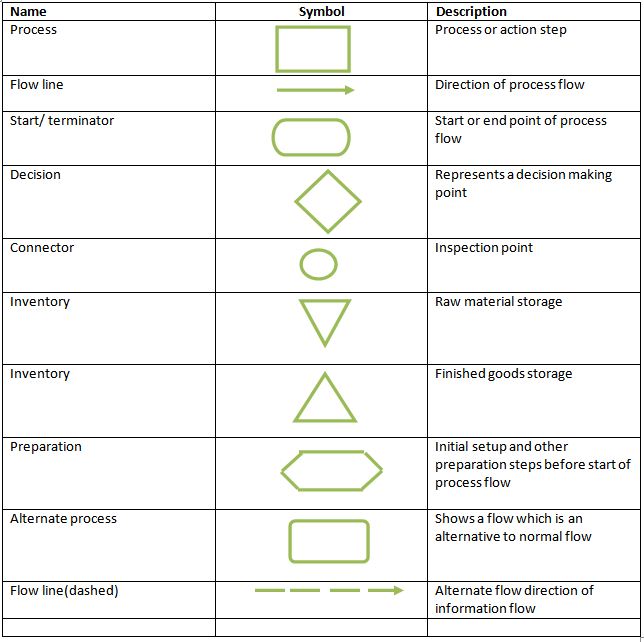
Processing symbol: Indicates specific processing (rectangle)
The rectangular symbol is called a processing symbol, and is a symbol that represents the content to be processed. Processing refers to specific tasks, actions, and movements, and is a step that passes through without branching.
It becomes difficult to understand if multiple contents are written in one processing symbol, so one processing content is written in one processing symbol.

Start/end symbol: indicates the start/end of the process (ellipse)
The oval symbol is a start/end symbol, placed at the beginning and end of a flowchart. These boxes, called terminals, are usually marked with “start” and “end.”
Document symbol: Indicates a document such as a form
A symbol with a wavy line at the bottom of a rectangle is a document symbol and indicates a document such as a form. Represents data on a human-readable medium and is placed over processing symbols because they are formed as processing progresses. If there are multiple documents, use the “multiple document symbol” that displays document symbols overlapping each other.
Judgment symbol: Indicates judgment in case of conditional branching (diamond)
The diamond symbol is a decision symbol and is used when there are multiple options in a flowchart. It is used in conditional branches such as “Yes/No” and “Yes/No” and in situations where judgment is required, and is placed when there are two or more judgment processes. Write the conditions in the box and display “Yes/No” or “Yes/No” on or near the arrow or line.
Connector symbol: indicates the union of separate elements (circle)
The circle symbol is a connector symbol and is used to jump to another process within the same flowchart.
When a flowchart becomes complicated or long and difficult to understand, it can be separated from the flowchart that was previously displayed, making it easier to see.
Off-page connector symbol: Indicates a combination of multiple pages
The symbol shaped like a baseball home plate is an off-page connector symbol that indicates the joining of multiple pages.
Indicates that a flowchart is continuous when it becomes complex or long enough to span multiple pages. The page number is usually written inside the symbol, but file names and reference information may also be written.
Input/output symbol: Indicates data entry/exit (parallelogram)
The parallelogram symbol is an input/output symbol, indicating data entering and exiting. Used when receiving external data as input or outputting data externally.
It is mainly placed when displaying databases and files separately, and the content of the data is written inside the symbol. Normally, if it is used at the beginning of a flowchart, it is considered an input, and if it is used at the end, it is considered an output.
Arrows/lines: Connect elements to show flow
Arrows and lines are used to connect elements such as processing symbols and judgment symbols, and to indicate the direction of flow. Use arrows when the direction of the flow is clear and progress in chronological order, and use lines when the flow is progressing simultaneously. Arrows and lines should not intersect or be diagonal, and simply connect elements to make them as easy to see as possible.

Types of flowcharts
There are mainly following types of flowcharts:
We will explain each flow in turn.
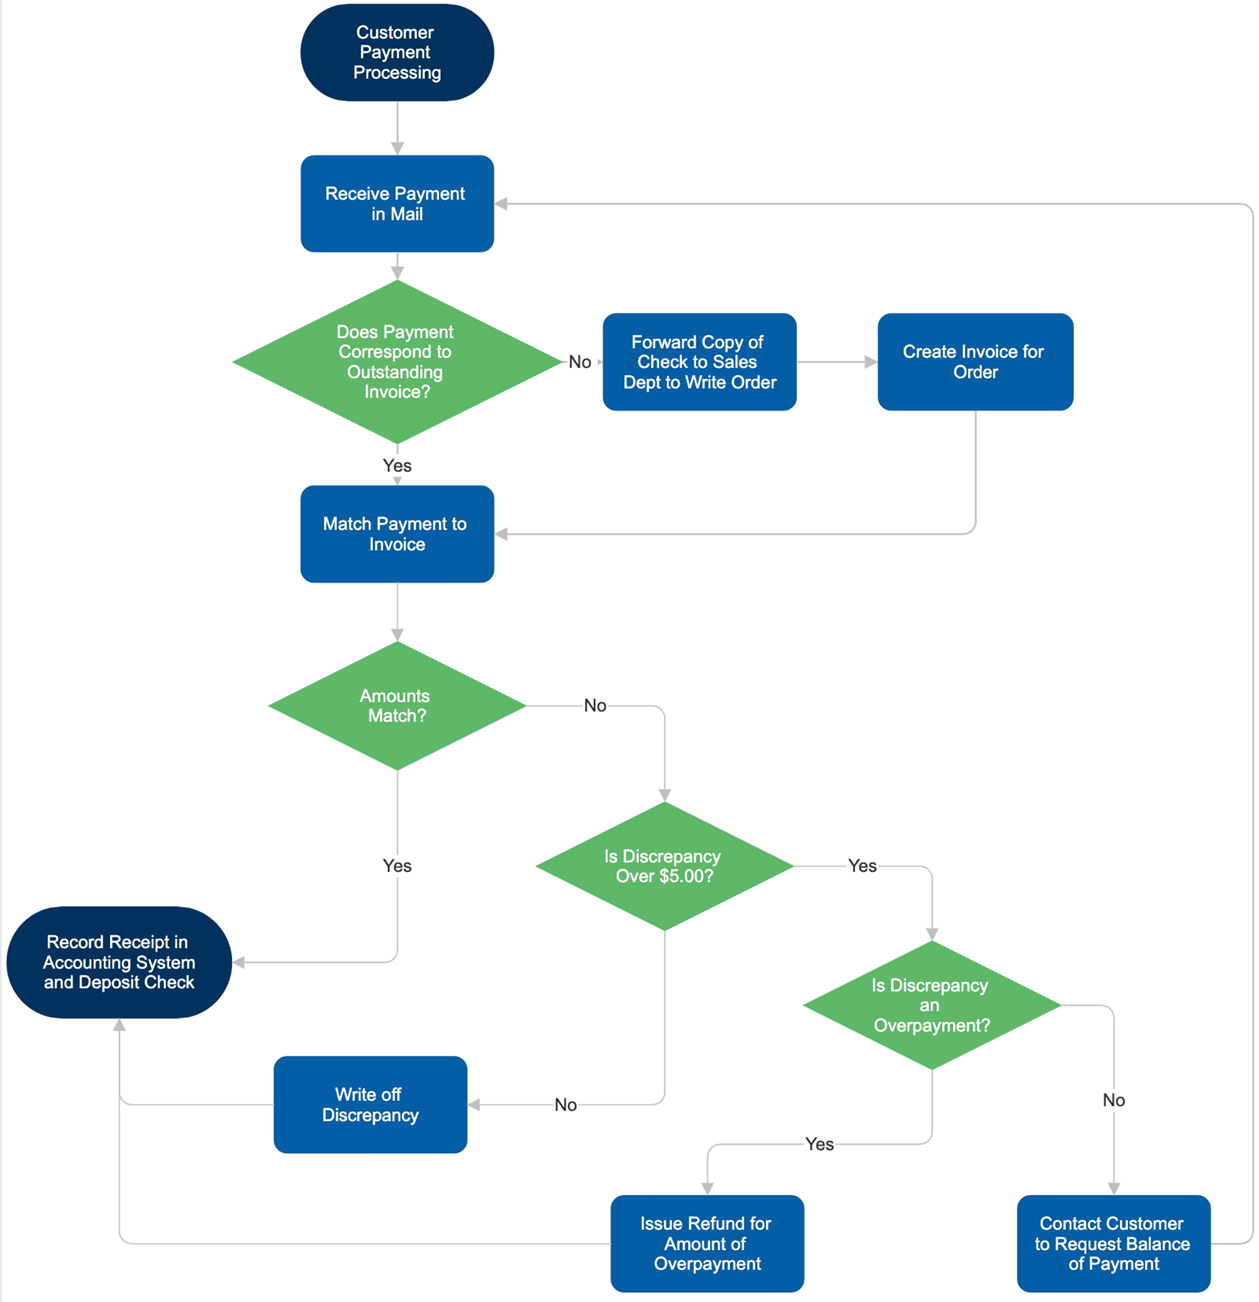
Decision flow
A decision-making flow is also called a “decision tree” and is used to determine the “intentions” that will be the basis of actions depending on the situation in situations such as business decisions and judgments when dealing with complaints. It refers to the flow.
Decision flow is useful when you want to clarify what solutions exist for a problem that arises, and what the consequences will be if you choose one of them.
A characteristic of the decision-making flow is that each decision symbol often branches into two choices: “yes” or “no.” If the answer is “no”, take action (such as research or organization) to make up for what is missing.
logic flow
Logic flow is a diagrammatic representation of the processing flow of IT-related systems such as software.
For example, if a development project team hires a new programmer and wants them to code the system, a logic flow will help them do their job smoothly.
On the other hand, without logic flow, development work itself would be impossible. Therefore, logic flow has become an indispensable flow in IT development sites.
System flow
System flow is a flow that expresses the operation and data flow of the entire system, and is used when designing and analyzing information systems and business processes. Although it is similar to logic flow, it mainly has the following uses and aspects.
System flow helps you understand the overall picture of your system and improve it and make it more efficient. System flow can be said to be a more general flow than logic flow.
product flow
Product flow refers to the flow that shows the flow from procurement of raw materials to shipping in fields such as manufacturing. The product flow mainly includes the following five steps.
1. Procurement
2. Production
3. Quality control
4. Inventory management
5. Shipping/Shipping
A clear product flow can help improve manufacturing efficiency and improve customer satisfaction. Efficient product flow, in turn, improves overall production and supply management, leading to lower costs and higher productivity.
process flow
A process flow is a flow that organizes the steps that should be taken to achieve a certain purpose in an organization such as a company.
For example, when applying for business travel expenses at a company, there is a flow in which a superior checks the application submitted by an employee and decides whether to approve or reject it, and what further steps are taken after the approval or rejection process is completed. There are flows that define how processing is performed.
Creating a process flow not only clarifies the flow of internal business operations, but also helps you refer back to it when you are unsure of a decision. Especially for tasks that are rarely performed, you may want to check the flow later, so it is recommended to create and save a process flow.
Other typical flowchart types
We have introduced the main flowcharts up to this point, but there are other flowcharts such as the ones below.
The optimal solution for flowcharts differs depending on “what kind of flow you want to organize and understand,” so it would be a good idea to create a flowchart that suits each problem solution.
Steps to create a flowchart
A flowchart is a useful tool for understanding the flow of a process, but actually viewing it requires a different perspective than creating the flowchart itself. When creating a flowchart, it is important to follow the steps below.
1. Determine the purpose
2. Identifying the people involved
3. Identifying the tasks of the people involved
4. Sort each task chronologically
5. Temporary operation and improvement of flowcharts
First of all, by clarifying the purpose of the flowchart, you will be able to create the flowchart more efficiently by reducing the number of errors and reworks when creating it. Once you have decided on the purpose, figure out who will be involved in the flow.
Also, the tasks of the people involved must be included in the flow, as it is necessary to include in the flow what kind of processing needs to be done by the identified people.
Once you have identified the people and tasks involved, try arranging them chronologically. Once you have created this, you can create a flow and add conditional branches to create a flowchart.
In this case, you can make the flowchart easier to read by arranging the tasks so that the lines used in the flow do not intersect as much as possible.
Finally, perform a temporary operation based on the completed flowchart to check whether there are any problems. If there are any problems, review and improve.
By following the process described above, you can create useful flowcharts.
How to write a flowchart
Below, we will explain how to write a specific flowchart.
Flowcharts are made up of three basic structures, which you also need to understand in order to create a flowchart correctly. The three basic structures will be explained below.
Furthermore, since flowcharts can be created in Excel, we will also explain how to draw flowcharts using Excel.
Three basic structures of flowcharts
A flowchart is made up of a combination of three basic structures:
By understanding these basic mechanisms, you will be able to create and read texts very easily.
Check the basic rules of flowcharts
When writing a flowchart, be sure to understand the basic rules of flowcharts. The following are the basic rules that you should especially understand.
Flowcharts are basically created and read from top to bottom and from left to right.
Also, the meanings of the boxes (symbols) used in flowcharts are determined by the JIS (Japanese Industrial Standards), so you cannot use arbitrary shapes.
How to write a flowchart
The flowchart will be written in the following steps.
1. Determining the project scope
2. Arrange each task in chronological order
3. Organize the types of placed tasks by dividing symbol
4. Create a flowchart
5. Improve the flowchart you created
1.Determine the project scope
A project’s scope is the amount of work required to complete the project, including everything from time to tasks to resources.
First, we will review the overall work content, understand the necessary management resources, and determine the project scope.
2. Arrange each task in chronological order
Check the overall work content and arrange each divided task in chronological order.
3. Organize the types of placed tasks by dividing symbol
Assign a flowchart box (symbol) to each task that has been divided and arranged in chronological order.
4. Create a flowchart
Connect each box (symbol) with arrows and lines and draw a flowchart. You can write flowcharts by hand, or you can use tools or applications.
5. Improve the flowchart you created
Once the flowchart has been created, it is shared with multiple people and checked to see if there are any problems or bottlenecks, rather than putting it into actual use.
How to draw a flowchart using Excel
Flowcharts can also be easily drawn using the flowchart shapes provided in Excel.
1. First, open Excel and click “Picture” from the “Insert” tab.
2. Then click “Shapes” from the drop-down menu
3. Then a frame labeled “Flowchart” will appear.
4. The shapes used in the flowchart are listed within that frame, so select and click the shape.
5. Click anywhere on the sheet to paste the selected shape at that location.
6. The pasted image can be easily scaled by dragging and dropping, so set it to the appropriate size and place it.
7. Repeat this process to paste shapes and place them appropriately.
8. Finally, select “arrow” and “line” from within the “line” frame and connect the boxes (symbols).
When to use flowcharts
Flowcharts are useful in the following situations:
Situations like these may occur many times in your daily work.
Therefore, flowcharts can be useful in a variety of situations. If you encounter the above situation in your daily work, you may be able to solve the problem smoothly by creating a flowchart.

summary
In this article, we explained the outline of flowcharts, how to write them, their types, and how to use symbols.
Flowcharts have a variety of uses, such as organizing information, solving problems, improving processing efficiency, and leveling out work.
In addition to checking flowcharts by looking at them, you can deepen your understanding by choosing a flowchart that is appropriate for the situation and creating it yourself, so if you are faced with a problem, try writing it yourself. Also recommended.
Let’s draw a useful flowchart while referring to the contents of this article.