

It is said that if it takes more than 3 seconds to click and open a website, more than half of the users will abandon the website. The speed of website traffic has a major impact on usability and also affects SEO search rankings.
PageSpeed Insights
provided by Google is a tool that measures the display speed of a website. This time, I will introduce how to use PageSpeed Insights and how to improve the display speed of your website.
You can check the display speed of your website from Google Analytics. Click here for details.
About improving page display speed ~ A simple way to understand Google Analytics | MarketTRUNK
What is PageSpeed Insights?
PageSpeed Insights is a free tool that measures and evaluates the display speed of your website. It is provided by Google for free, and you can see the evaluation of display speed on mobile and PC.
No special settings such as tags are required, and you can easily use it by simply entering the URL of the website whose display speed you want to check. Therefore, you can easily check not only your own website but also the websites of your competitors.
It also measures the display speed of your website and suggests modifications to improve display speed. By making improvements according to the correction points, you can improve the display speed.
The importance of website display speed
In 2018, Google announced on the “Google Webmaster Official Site” that it would be applied not only to desktop searches but also to mobile searches when evaluating search rankings based on page loading speed.
“Load speed has traditionally been used as a ranking signal, but only for desktop searches. So today we’re announcing that starting July 2018, page load speed will be used as a ranking factor for mobile searches. I would like to tell you.”
*Excerpt from “
Using page loading speed as a ranking factor for mobile search
”
The display speed of a website also affects SEO, and the above announcement clearly mentions that sites with slow display speeds will have lower search rankings, and there is a need to improve display speed.
Additionally, if the display speed is slow, users may become impatient and leave the page, leading to a worsening of the exit rate and bounce rate. As the exit rate and bounce rate worsen, the conversion rate also decreases, and the overall performance of the website deteriorates.
From a usability perspective, website display speed is extremely important.

What you can learn from PageSpeed Insights
By measuring and evaluating your website’s display speed with PageSpeed Insights, you can find out the following:
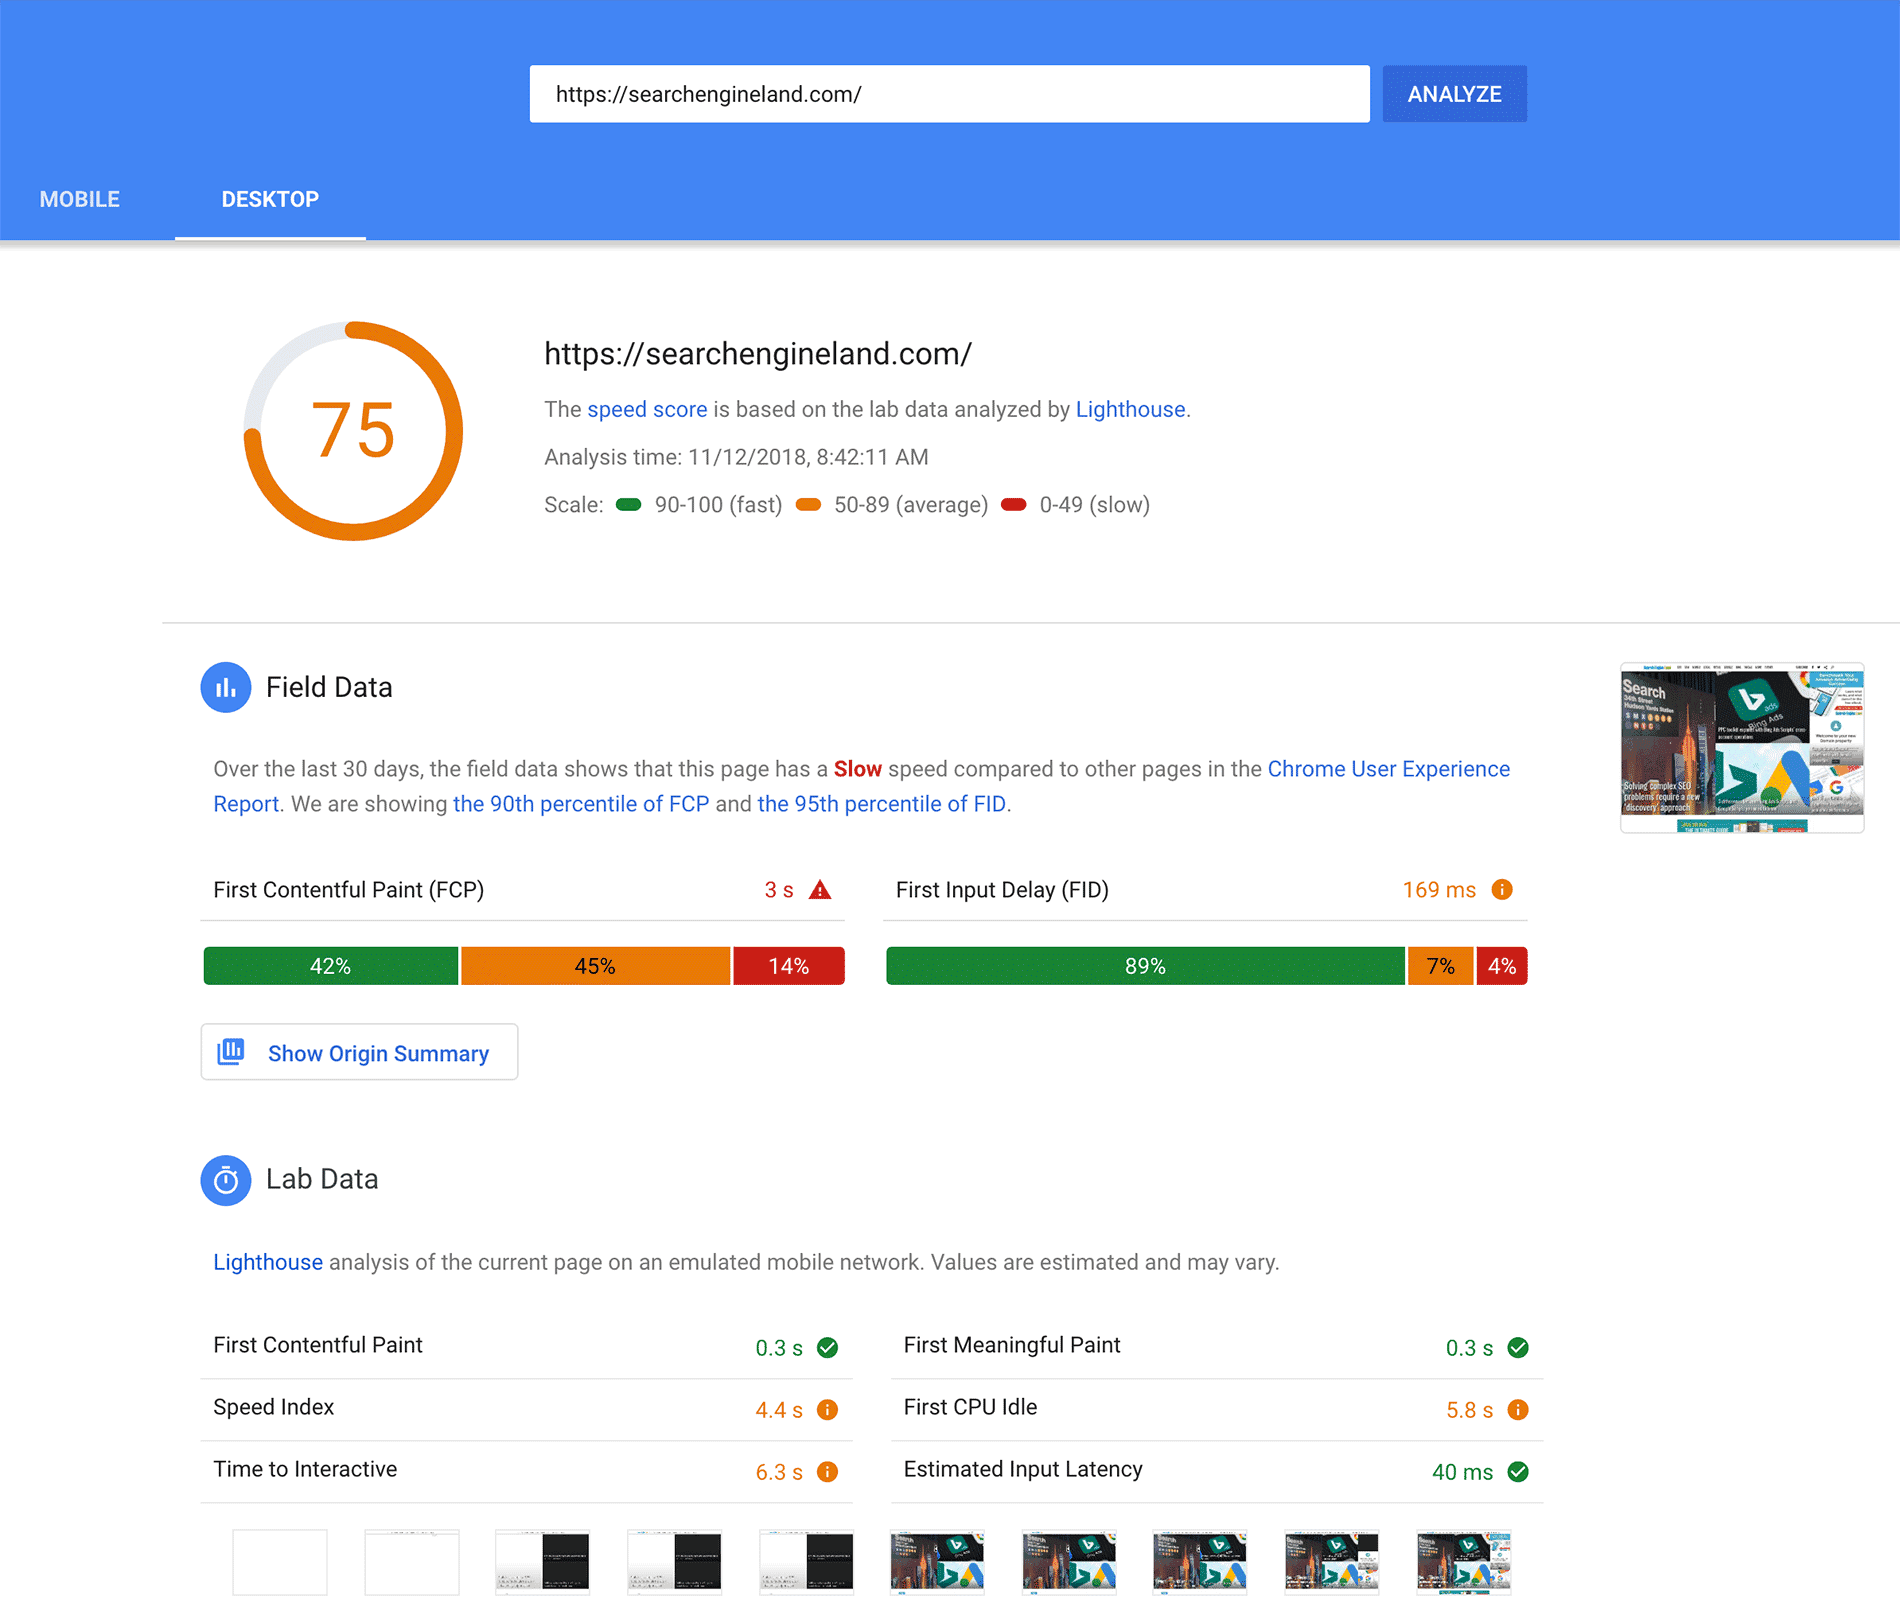
①Display speed score
First, on the measurement/evaluation results screen, you can check the display speed judgment score. Furthermore, the judgment score is color-coded according to the three evaluations.
- Score 0-49: Displayed in red, relatively bad evaluation
- Score 50-89: Displayed in yellow and requires relative improvement
- Score 90-100: Displayed in green, relatively good evaluation

By the way, when we measured it on our site, the score was 45 for mobile and 82 for PC. In fact, mobile tends to be lower than PC, and it is said that it is difficult to exceed 50 for mobile.
In addition, since PageSpeed Insights measures display speed from overseas, Japanese sites tend to be lower, and while recognizing that the evaluation is relative to sites around the world, It is a good idea to improve the score so that it exceeds 40 and 80 for computers.
②Field data and laboratory data
Field data is displayed below your website speed score. The field data is color-coded according to the display speed of each of the four items and its evaluation, which is the same as the display speed score in ①.
- First Continental Paint (FCP): How long does it take for text and images to appear?
- First Input Delay (FID): Time from action such as click to reaction
- Largest Contentful Paind (LCP): How long does it take for the largest text or image to appear?
- Cumulative Layout Shift (CLS): Unexpected layout breakdown
The field data uses data from the Chrome User Experience Report (CrUX), which is designed for Chrome users. Below the field data is the lab data.
Lab data displays measurement results using “Lighthouse”. “Lighthouse” is a tool for auditing web applications, provided by Google. Lab data evaluates display speed using six items.
- First Contentful Paint: Time until text or image appears
- Speed Index: The time it takes for your site’s content to be displayed after it’s loaded.
- Largest Contentful Paint: Time taken for the largest text or image to appear
- Time to Interactive: Time until the site is fully operational
- Total Blocking Time: Time from when the site is displayed until it can be operated
- Cumulative Layout Shift: Unexpected layout breakdown

③ Items that can be improved
After checking the display speed of each item using field and lab data, look below for areas that can be improved.
Items to be improved and predictions of how much time can be saved if improvements are made are also listed. You can select the display speed you want to improve from the “Show related audits” tab, prioritize it, and work on improving it.
Details of the correspondence for each item are introduced below.

④Diagnosis and passed audit
Below the items that can be improved, you can see the diagnostics and passed audits.
- Diagnosis: Displays diagnostic results to see if the site display speed is suitable for web development or close to the settings
- Passed audit: Out of all 34 items, items that were diagnosed as having no problems

How to improve website display speed
We will introduce the main points on how to deal with the above-mentioned “items that can be improved.”
① Image optimization
Items that can be improved:
- Image of appropriate size
- Delivering images in next-generation formats
- efficient image format
Compress the displayed image data to reduce the size of the image. You can reduce the image size by reducing the image size, but the image quality will also drop, so compress the image while leaving the image size unchanged. You can use free online image compression tools to reduce image size as much as possible while maintaining acceptable quality for the human eye.
Online image optimization tool
Compress images online. Best image quality and compression method
②Delete unnecessary JavaScript/CSS
Items that can be improved:
- Reduce unused JavaScript
- Reducing unused CSS
Improve loading speed by removing unused JavaScript and CSS code.
③ Slow down the loading of images other than first view
Items that can be improved:
- Lazy loading of offscreen images
By slowing down loading so that images that are not displayed in the first view are loaded and displayed in order according to the speed at which the user views them and the timing of scrolling, the time it takes for users to be able to operate them is shortened.
This can be done simply by adding the “loading=”lazy” element to the HTML code of the target image.

summary
- PageSpeed Insights is a free tool that measures and evaluates website display speed. No special settings such as tags are required; you can easily use it by simply entering the URL of the website you want to check the display speed of.
- Website display speed also affects SEO, and is extremely important from a usability perspective as it can lead to a decrease in the number of conversions due to worsening of exit and bounce rates.
- Since PageSpeed Insights measures display speed from overseas, we are aware that the evaluation is relative to sites all over the world, and we are working to improve it to over 40 for mobile and 80 for PC. It’s good to proceed
- Items to be improved and a prediction of how much time can be saved if the improvements are made are listed, and you can select the display speed you want to improve from the “Show related audits” tab and prioritize the improvements.