

A website is not finished once it is created; from there, we use tools to analyze it and make improvements based on the analysis results. We will then analyze the improvement results and make further improvements on an ongoing basis.
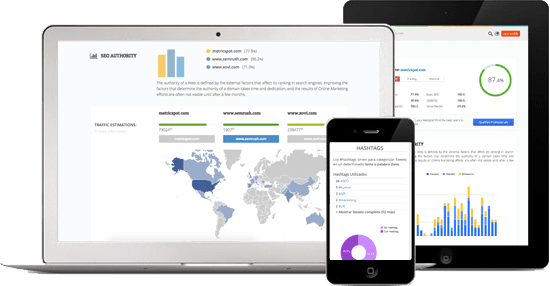
However, there are a variety of tools for analyzing websites, including access analysis tools such as Google Analytics, heat maps, and competitor site analysis tools. Only by properly utilizing these tools and analyzing your website can you make the right improvements.
This time, we will introduce some points you should keep in mind when using website analysis tools. Please see below for columns regarding website analysis.
Results can vary depending on how you approach web analysis | MarkeTRUNK
Minimum necessary tools for website analysis
The minimum necessary tool for website analysis is Google Analytics. Google’s website analytics tool lets you see where users come to your website and what actions they take while on your website.
A similar tool is Google Search Console, which allows you to analyze user behavior before visiting your website. Google Search Console data can be checked within Google Analytics, so in reality, only Google Analytics is sufficient.

Website data analysis using Google Analytics ① Customer attraction analysis
We will use Google Analytics to analyze website data. Google Analytics performs customer attraction analysis and behavioral analysis.
First, let’s analyze the audience. In customer acquisition analysis, we investigate where users are coming from and perform analysis to increase the number of accesses.

⑴Search engine analysis
We analyze search engine inflow routes and utilize them to improve the performance of web advertisements. It can be applied not only to search engines, but also to improving the performance of SNS advertisements if there is an inflow to SNS.
① Access “Referrer/Medium” under “All Traffic” from the “Acquisition” menu in Google Analytics ② Check the number of sessions, number of CVs, and CVR for each search engine ③ Google (google / organic *Natural from Google Inflow, and google/cpc *Google Ads) is Yahoo! (Yahoo/organic *natural traffic from Google and Yahoo/ cpc *Yahoo! ads), invest more advertising budget in Google and improve web advertising performance.
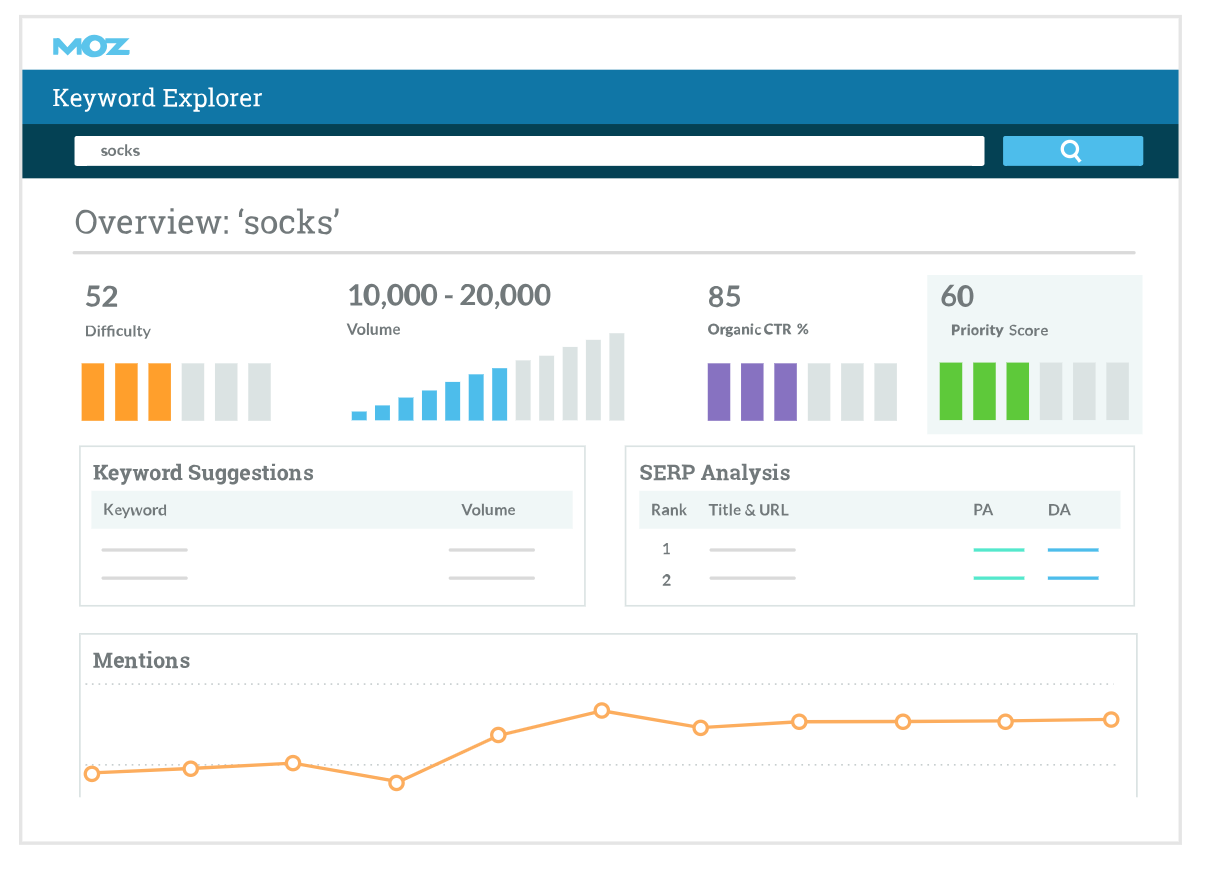
⑵Keyword analysis
We analyze user search words and strengthen specific keywords to increase customer attraction.
① Access “Search Query” in “Search Console” from GA’s “Acquisition” menu ② Check the number of clicks, number of impressions, click rate, and ranking of the keyword ③ Despite the number of impressions, the ranking is low. For keywords with a low number of clicks and click rate, strengthen SEO measures or display them higher in web ads to increase traffic.
Analyze search intent and use SEO-effective keywords in your content | MarketTRUNK

Website data analysis using Google Analytics ② Behavioral analysis
Next is behavior analysis. Behavioral analysis involves analyzing which pages users enter (landing) and which pages users exit (exit), discover user interests and site problems, and improve them.

⑴Page transition analysis from the top page
Analyze the next page from the user’s landing page to understand the user’s interests and use them in designing the flow of the website.
① Access “Landing Page” under “Site Content” from the “Behavior” menu in Google Analytics ② Check which page users are coming from and click the “Transition from Entrance” tab next to “Explorer.” Click ③ Check the next page displayed from the top page with the most traffic ④ Understand the user’s interests from the next page displayed, and change the content such as changing the order of the content on the top page or the location of the CTA. make it easier to approach
How to improve conversion rate by designing and reviewing CTA | MarketTRUNK

⑵ Bounce/exit page analysis
We will analyze pages with high user bounce rates and exit rates, and make improvements to improve the bounce rate and exit rate, and to lead to more visits within the site and CV.
① Access “All Pages” under “Site Content” from the “Behavior” menu in Google Analytics. ② Check the number of page views, exit rate, number of views initiated, and bounce rate. , Understand pages with high exit rates (bounce rates) and reduce page exits
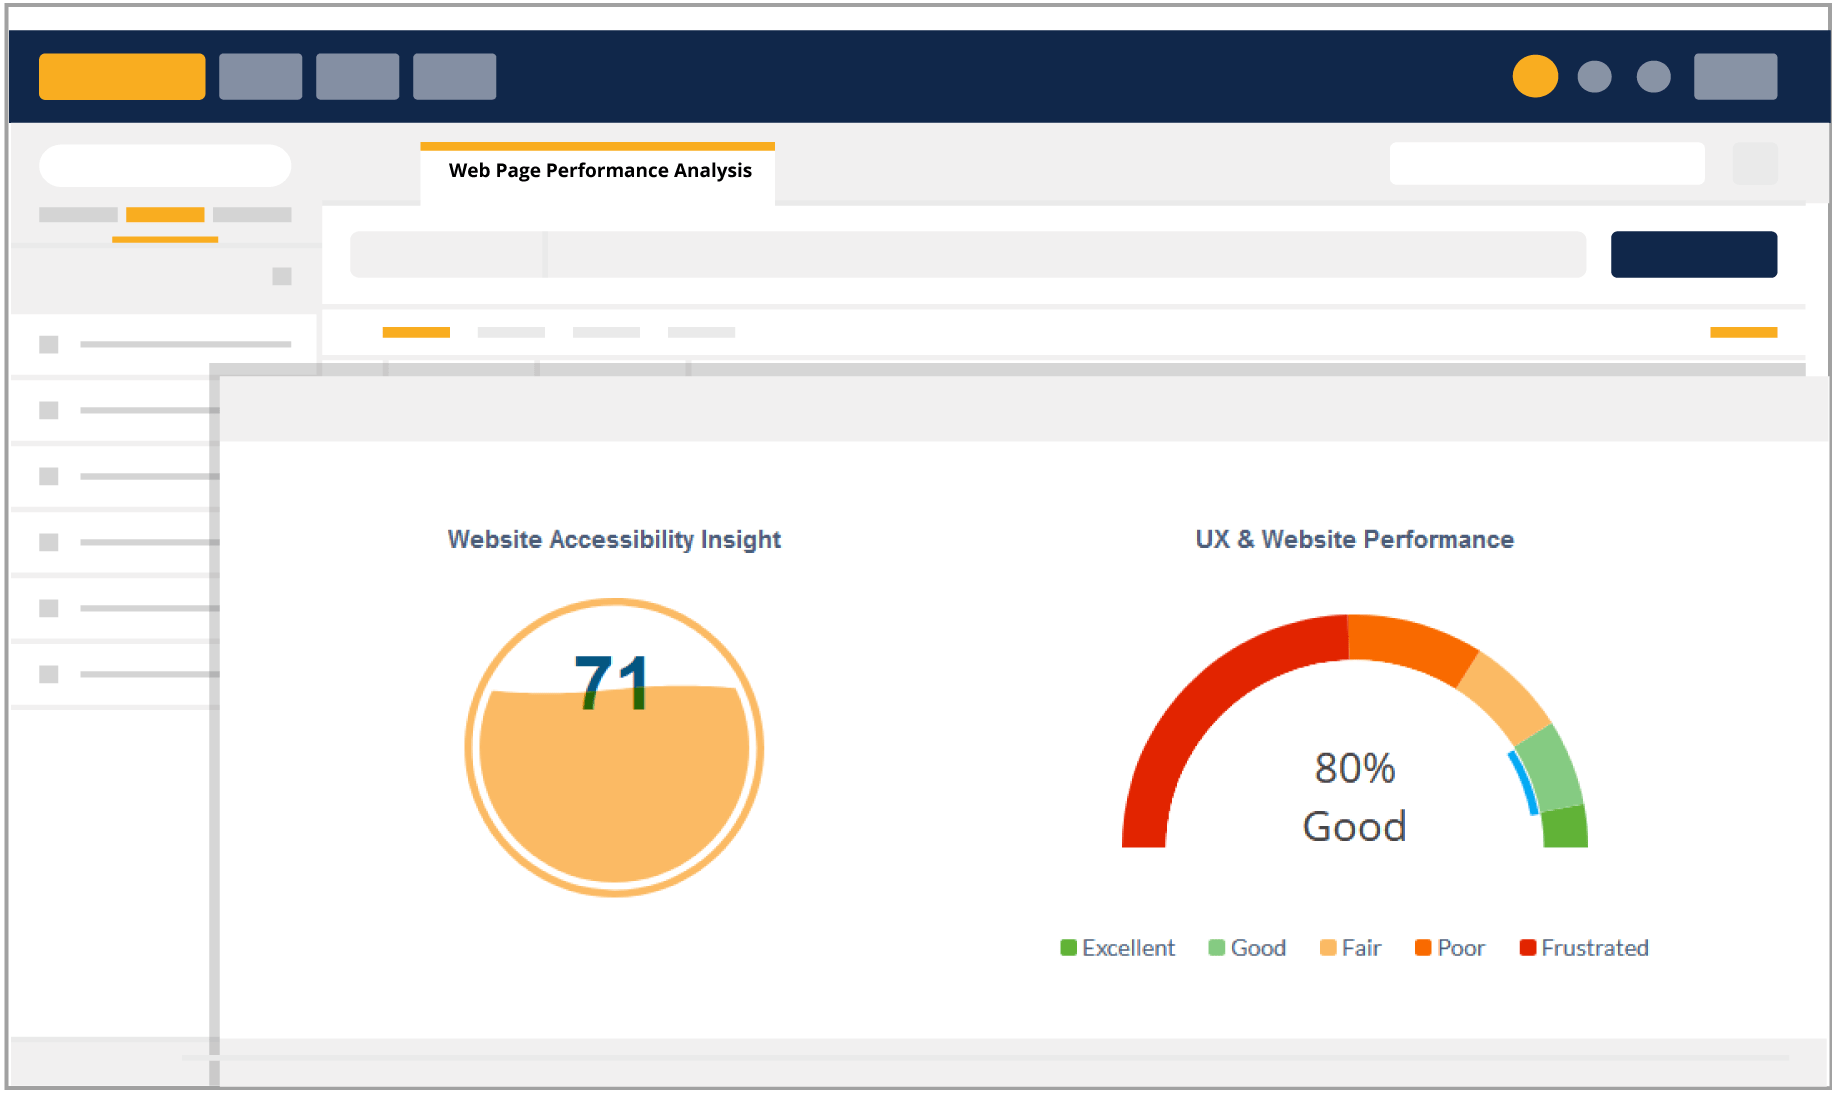
User behavior analysis using heatmaps
You can use heatmaps to analyze user behavior on each page of your website. In conjunction with GA’s behavior analysis, we can improve the page by understanding which parts of each page are looked at most, where people are clicking on them, and where they are leaving the page.

⑴Perspective reading area
You can see which parts of a page are being read and which parts are not. The more read it is, the more red it will appear, and the closer it gets to green and blue, the less read it will be.
For parts that you want people to read but don’t read, we will make improvements to improve readability, such as inserting figures and tables. In addition, you can improve the withdrawal rate by deleting unread parts of the page if it is determined that there is no user need for it.

⑵Click area
You can see which parts of the page are being clicked. Areas with a high number of clicks are displayed in red, and areas with a low number of clicks are displayed in green.
If there is a place where there is no button but people are clicking on it, set up a CTA that responds to the action the user wants. Users will either want to enlarge the screen or click a button, so place appropriate CTAs in accordance with the context of your content.
⑶Escape area
You can see what percentage of users who view your page leave. If the exit rate is high at the top of the page, the display speed may be slow and users may be abandoning the page. Improve page speed with site speed tools.
Also, if the exit rate in the CTA area is increasing, review the CTA design, lead text, and buttons. Also, if people are leaving above the CTA area, you can increase the CTA click rate by moving the CTA area above it.
Content analysis using site competitive analysis tools
By using a site competitor analysis tool such as Similar Web, you can understand basic data such as the number of inflows to competing sites and inflow channels, how competitive sites are displayed for specific keywords, and even the main keyword and appearance rate. You can.
When analyzing competitive sites, you can analyze the content of the pages that are ranked high and actively work on the points that are better than your own site, which will lead to improvements in length of stay.
Win over competing sites! What is site competitive analysis useful for web marketing? | MarketTRUNK
summary
- Google Analytics’ customer acquisition analysis investigates where users are coming from and performs analysis to increase the number of accesses.
- In addition, behavioral analysis analyzes which pages users enter the site from (landing) and which pages they exit from (exit), discovering user interests and problems with the site, and improving it.
- In conjunction with behavioral analysis from Google Analytics, we can use heat maps to understand which parts of each page are viewed frequently, clicked on, and where people leave the page to improve the page. connect to
- When analyzing competitive sites, you can improve the length of stay by analyzing the content of the top-ranked pages and proactively focusing on the points that are better than your own site.