

These days, data utilization is actively being carried out, such as with the wave of
DX
promotion. Many companies are introducing and utilizing BI tools. When considering the introduction of BI tools, business people want to know what functions and benefits they have, and what types of BI tools are available. Therefore, this time, we will introduce 10 recommended BI tools along with a basic explanation of BI tools.
What is BI tool?
The BI tool BI is an abbreviation for Business Intelligence, which refers to information useful for business decision-making. Intelligence is “intelligence, understanding, wisdom” and is therefore interpreted as “information.”
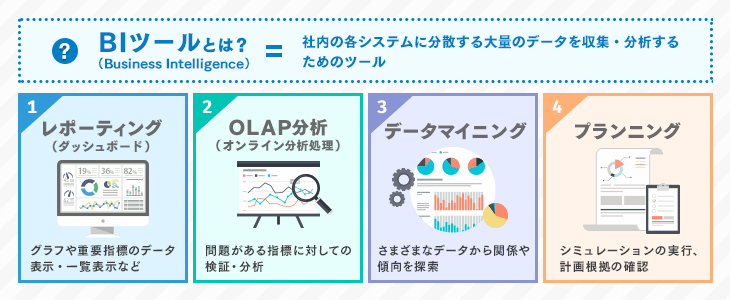
BI tools are software that collects, analyzes and visualizes large amounts of data accumulated by companies, and supports companies in making quick decisions regarding management and sales.
Purpose of using BI tools
The purpose of BI tools is to support decision-making that is necessary for your company. We centralize the various data that exists within the company, analyze the data necessary for decision-making, and create reports that can be visualized.
Traditionally, many companies have performed analysis by graphing numbers in Excel and viewing them, but the more data there is, the more difficult it is to manually organize and analyze all the data in Excel. Probably.
In addition, the number of companies that are achieving growth by promoting data utilization using BI tools and other tools is increasing year by year. Similar trends are now being seen not only in IT-related companies but also in various industries. Given the above, in order to keep up with competitors, we cannot reduce the amount or type of data we handle.
Although there are other reasons behind this, the use of BI tools has become indispensable for its purpose of visualizing vast amounts of data.
Usage scenarios for BI tools
Management department: Business analysis, financial analysis, budget analysis, etc.
For management, it is essential to understand data in a timely manner. Particularly as business accelerates, the need to quickly analyze and visualize data such as sales and financial status is greatly increasing. Analysis at the right time will create a competitive advantage.
Sales department: Sales analysis, sales analysis, etc.
It is no exaggeration to say that the sales department is the second most important department after the management department. By introducing BI tools, you can quickly analyze the performance and current status of each salesperson, from daily sales analysis to sales analysis.
In addition, know-how in the sales department tends to be individualized, but by objectively analyzing it using BI tools, it is possible to grasp the trends of each person in charge, which can lead to the standardization and training of sales skills. It’s possible.
Human resources department: Human resources data analysis, etc.
Human resources departments can also use BI tools to analyze human resources data.
Human resource allocation and personnel evaluation based on intuition and experience are already outdated, and by analyzing data using BI tools, it is possible to make appropriate human resource allocation based on objective data.
In addition, BI tools can connect data from human resources systems and attendance management systems to perform overtime analysis, which can lead to reductions in overtime through work style reform.
Marketing department: customer analysis, sales timing analysis, store location analysis, etc.
Marketing
departments can use sales data, customer data, detailed store data, etc. to perform customer analysis, sales timing analysis, store location analysis, etc. By visualizing the analysis result data, you can consider future sales strategies and promotional marketing plans for each store based on the data.
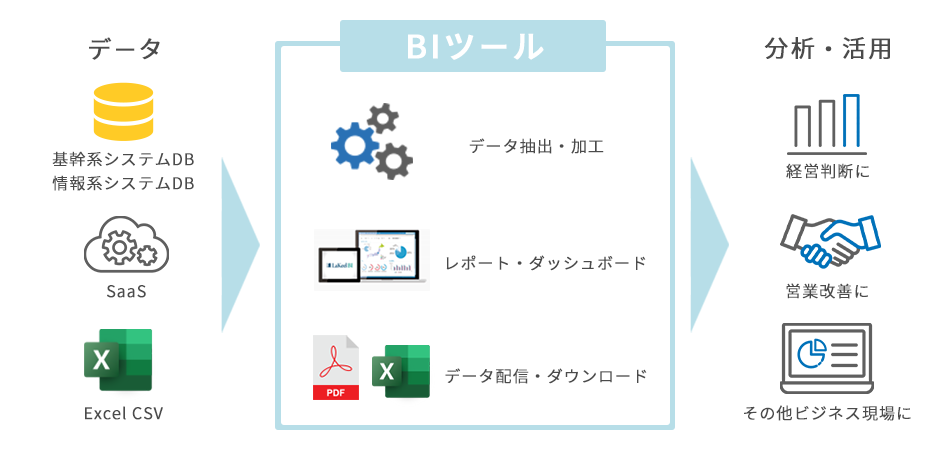
How BI tools work
There are many BI tools available today, but they all share the same basic structure. When using BI tools, you need to go through the following three main steps.
1. Aggregate data and input into BI tools
2. Aggregate data and perform analysis
3. Visualization of analysis results
Make decisions using the data visualized in step 3. Next, let’s take a closer look at each process.
1. Aggregate data and input it to BI tools
We aggregate all the data in your company’s core systems and business systems. When companies try to centralize data and create a database, they typically find that data exists in a variety of formats. BI tools compile and organize this data. The data formats that can be processed vary depending on the BI tool, and some BI tools can import data in Excel format or
CSV
format.
2. Aggregate data and perform analysis
Once the data has been collected, formatted, and aggregated, it is time to analyze it. The types of analysis functions vary depending on the BI tool. For example, OLAP analysis is a method that allows you to analyze data from various angles and objectively evaluate problems. Use these features to perform analytical work.
3. Visualize analysis results
Once the analysis work is complete, visualize the analysis results. The process involves visualizing and displaying the results. You can visualize the analysis results by creating graphs and charts.
BI tool features
BI tools have various functions. The main features that many BI tools have are:
ETL (data processing) function
Data collected from multiple internal systems into a BI tool is output in a format that is easy to analyze using the ETL function, which takes the steps necessary for data processing.
ETL is an abbreviation for “Extract,” “Transform,” and “Load,” and refers to the process of data processing.
The extracted data is converted, processed, and output to a data warehouse, etc.
Data warehouse (DWH) functionality
BI tools also have data warehouse (DWH) functionality. The data output by the ETL function mentioned above is organized in chronological order, by customer, etc., and then accumulated in the integrated database. This prepares the data for easy analysis.
OLAP analysis function
OLAP is an abbreviation for “Online Analytical Processing” and is translated as ”
Online
Analytical Processing”. This is a function that uses multiple pieces of data to analyze data in multiple dimensions from various angles. Because we look at things from multiple angles and verify them, we may see things that were previously invisible.
For example, let’s say your sales suddenly drop. It is necessary to find the cause as soon as possible, but it may be difficult to investigate the cause manually. This is where the OLAP analysis feature comes in handy. Since you can analyze the huge amount of data you have accumulated from multiple angles using multiple pieces of data, you can easily identify the cause of a decline in sales.
Data mining function
Data mining function is a function that derives rules from data. This allows you to discover laws that you were not aware of before. Discovering commonalities and rules in relationships and trends between data can help improve business operations and increase sales.
The reason why data mining is necessary is because by simply reading each piece of data, you will not be able to see any trends or problems. Data mining reveals trends that were previously unknown, making it easier to find ways to improve issues.
Planning (simulation) function
The planning function is a function that makes predictions using data and makes recommendations to support decision-making.
Just visualizing data does not tell us what changes may occur in the future.
By performing simulations, it is possible to predict how sales will change due to changes in the situation, and to formulate optimal plans.
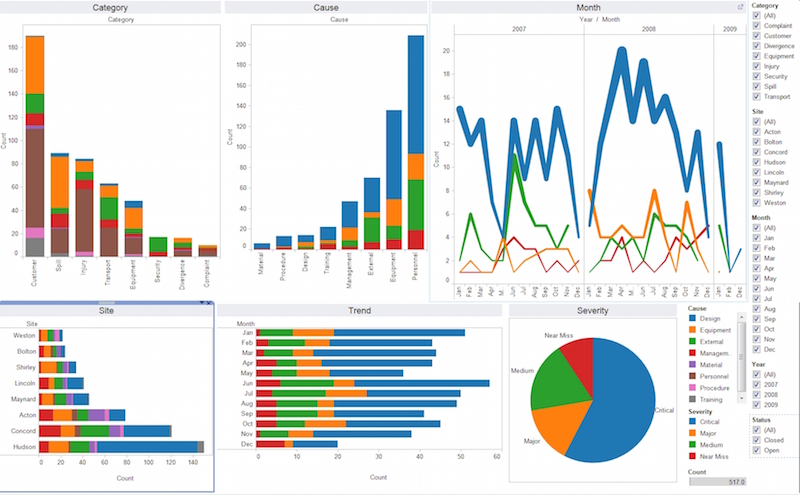
Reporting function/Dashboard function
One of the most frequently used reporting functions in BI tools is the dashboard function. Data can be visualized on the dashboard. In other words, the dashboard function is a function that allows you to visually display data analysis results in the form of graphs and charts.
Each time the data is updated, the graphs on the dashboard are updated in real time, allowing you to quickly check the data and take timely responses. Dashboards can be visually understood not only by executives but also by general employees, allowing them to make decisions based on data in their daily work.
Background to the spread of BI tools
BI tools are currently being introduced by many Japanese companies. Let’s explore the background to why each company is introducing it.
Wave of big data utilization
In recent years, the use of big data has become more active. There is a growing movement to utilize all kinds of data to aid management.
Just the other day, the Ministry of Internal Affairs and Communications opened a website called “Big Data Portal” to promote the use of big data, and it attracted attention.
Data collection, analysis, and visualization tools such as BI tools are essential to making quick and accurate decisions using big data. Utilizing BI tools will likely become the norm for Japanese companies in the future.
Diversification of customer behavior
Traditionally, the relationship between companies and customers has been simple, with companies simply providing goods and services unilaterally. However, times have changed, and with the development of Internet technology in recent years, customer needs and values have become more diverse. Customers now collect information on their own, make comparisons, and select the one that best suits their tastes.
In addition to providing one-sided products and services, companies now need to obtain and analyze all kinds of information, including customer behavior, preferences, and sales data.
Under these circumstances, customer analysis and sales analysis using BI tools has become essential for being chosen by customers.
Challenges in data utilization
Even if we collect vast amounts of data to derive solutions to the challenges we face, data aggregation and processing cannot be done solely by hand. If you have problems such as not knowing how to analyze or how to utilize visualized data, you will not be able to utilize the data effectively.
BI tools can help solve these problems.
Penetration of remote work due to the coronavirus pandemic
The coronavirus pandemic has had a major impact on changes in business and operations. Remote work has become widespread, and companies are increasingly using cloud-based tools that can be accessed from anywhere as long as there is an internet environment.
BI tools are one of them, and they are becoming easier to use and utilize.
Advantages of introducing BI tools
What are the benefits of implementing BI tools? We will introduce the main benefits that companies can get from using BI tools.
Discovering issues and formulating strategies without relying on intuition or experience
By analyzing and visualizing data with BI tools, you can discover latent issues in your company at an early stage. This will allow you to quickly respond to problem-solving.
You can also easily understand and predict market trends, compare with competitors, and develop differentiation strategies. This will lead to decision-making based on objective evidence based on data, rather than relying on traditional intuition and experience.
Centralize and analyze data scattered within the company
As mentioned earlier, BI tools have data collection and processing functions. Data that is scattered throughout the company can be unified, which also leads to data organization.
Data is generated every day, and the question is how to manage and utilize it. It can be said that auxiliary tools for data utilization such as BI tools are now indispensable for companies.
Quick management decision-making through visualization
BI tools have reporting functions that automatically visualize data when analyzed. This makes it possible to make management decisions more quickly than when deciphering traditional numerical data.
Improving the efficiency of report creation work
BI tools can automate a series of operations that analyze data, summarize it in graphs and tables, and create reports. As a result, the previous workload will be eliminated and you will be able to spend more time discovering issues and formulating strategies.
10 recommended BI tools
There are many BI tools, but this time we will introduce 10 of the most recommended tools.
1.LaKeel BI

LaKeel BI is a self-service BI that allows even regular employees who are new to data analysis to easily analyze data. Self-service BI is a BI tool that allows users without specialized knowledge, such as data scientists and data analysts, to analyze data and create reports. It is also intuitive to operate, making it easy to speed up decision-making and use it for business purposes.
LaKeel BI has an Excel-like screen structure that is easy to understand even for the average business person, and can be easily operated using drag and drop. It has ETL functions, data analysis functions, report/web dashboard creation functions, etc.
2.Looker Studio (formerly Google Data Portal)
Looker Studio is a free BI tool provided by Google. Formerly known as Google Data Portal, the name changed to Looker Studio in October 2022.
It is characterized by easy integration with various Google services such as Google Analytics and Google Ads. You can easily import data in Excel format that you own in-house by importing it into Google Spreadsheets.
Web page access analysis data can be used as information for making important decisions regarding marketing and promotional activities. The reporting function allows data to be visualized in graphs and tables, as well as
PDF
output, making reporting easier.
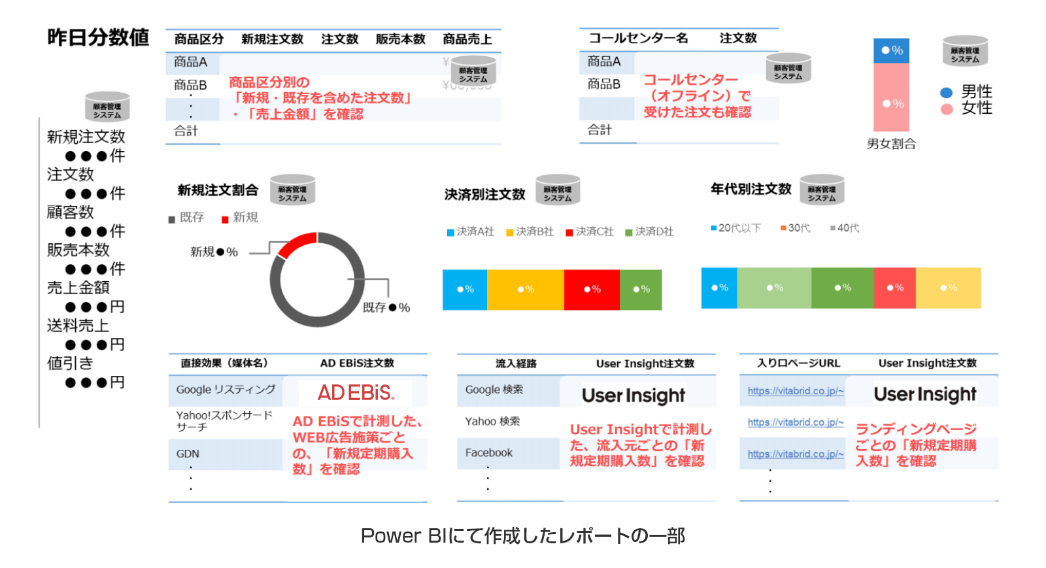
3.Microsoft Power BI

Power BI is a BI tool provided by Microsoft and is classified as self-service BI. The best feature of Power BI is that it is compatible with products provided by Microsoft such as Microsoft Office.
Power BI consists of three parts: “Power BI desktop”, “Power BI Service” and the Power BI mobile app. “Power BI Desktop” is a desktop application that is installed and used on your PC. Extract any data source, transform it, combine it, and even design reports.
“Power BI Service” is a service for performing data analysis on a cloud browser, and allows you to share reports in the cloud.
The Power BI mobile app lets you access Power BI reports from your smartphone or tablet.
4.Senses BI

Senses BI is a BI feature of a sales automation tool (SFA) called Senses. Data accumulated in Senses is quickly and flexibly aggregated and visualized on one
platform
, promoting data utilization in sales activities.
Specifically, in addition to centralizing analysis data, we will drill down into the data to analyze factors and promote data utilization. It can be configured with no-code or low-code, and reports can be created and shared within the company.
Because BI can be used on the same platform as Senses SFA, it has the advantage of being easily established, especially by members of the sales department. It is also suitable when you want to use BI tools for sales decision making.
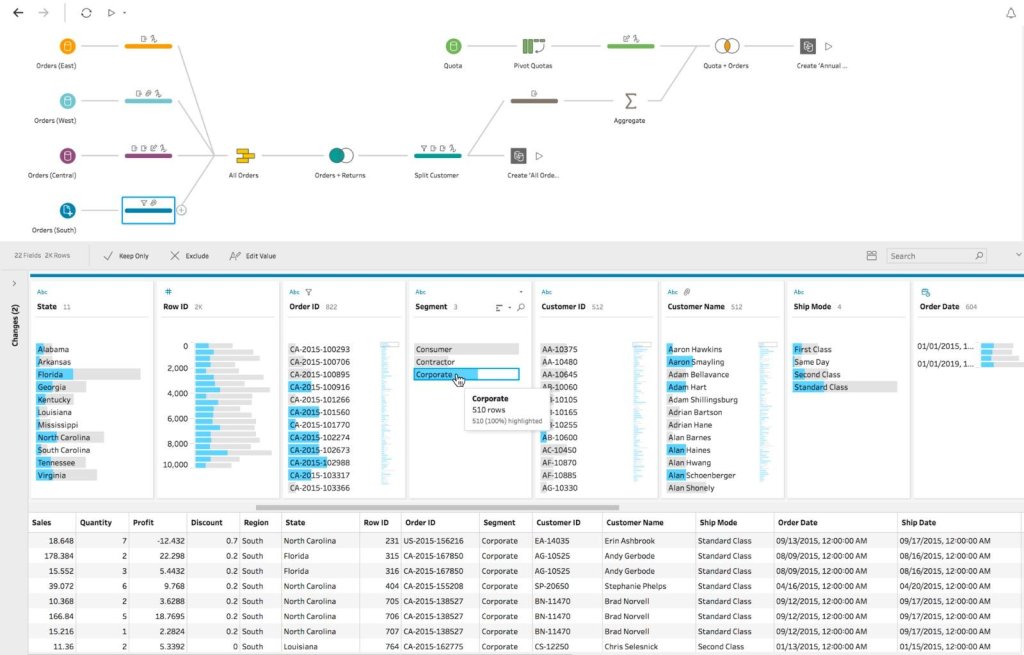
5.Tableau

Originated in the United States, Tableau is a self-service BI that allows users to perform the analysis they need, when they need it. There is no need to predetermine the analysis target or viewpoint, or do any programming.
It is also possible to perform cross tabulations and visualize with charts, enabling quick decision making. Created forms and dashboards can be shared within the company, and can also be viewed on mobile devices, making it an excellent tool for data sharing.
Intuitive operation allows anyone to easily visualize and analyze data.
6.Fine Report

FineReport is a service originating from China and is a report/BI tool that is being expanded internationally. One of its characteristics is that it can handle a variety of tasks through low-code development and system coordination. It is an integrated electronic form solution that supports data integration, form layout design, and operation, and can also create multifaceted analysis dashboards. Another feature is that the database can be updated in real time by inputting and transmitting data in business forms and reports.
FineReport is also mobile-friendly and can be incorporated into other companies’ mobile apps, so you can understand your company’s information anytime, anywhere.
7.Srush
Srush is attracting attention as a new generation BI tool and is being used by many companies.
Unlike traditional BI tools, anyone can easily unify data and start analyzing data right away. In fact, it seems to have been well received by companies where data unification and analysis work was left to individual individuals.
A feature of Srush is that its operating costs are reasonable. It is easy to install and allows you to connect CSV and Excel format data with just a few clicks. We also have a strong support system, and will accompany you from installation until operations are on track.
8.Domo
Domo, which originated in the United States, is used by more than 2,000 customers around the world, including startups, large corporations, and government agencies, helping each company achieve data-driven management.
One of the selling points is the speed with which the BI tool can be up and running in as little as 5 minutes after installation. It has a wealth of templates and allows you to easily build dashboards. We offer a one-stop service for various measures and effectiveness verification.
9.MotionBoard

MotionBoard is a self-service BI that can implement the functions necessary for data utilization on a single platform, and is an in-house developed product made in Japan.
Aggregation and analysis tasks tend to be left to the individual, but with MotionBoard, you can easily do it without any specialized knowledge. It has a report output function and allows you to share visualized information within your company, allowing you to promote data utilization throughout your organization.
Report functions can be expressed to meet the specific needs of each industry. For example, maps and calendars are available for the retail distribution industry, and control charts and Gantt charts are available for the manufacturing industry.
MotionBoard has extensive support, and training videos and manuals are available, so it will be easy to disseminate it throughout your company.
10.Yellowfin
Yellowfin is a BI tool used worldwide. It has a function that automatically catches changes in the collected data and notifies you of the background of the change as an alert.
It not only detects abnormal values, but also has an insight function that automatically analyzes the causes of abnormal values, so it is a tool that can quickly respond to changes and can be used even by ordinary employees without specialized knowledge.
It is simple and easy to use, and the data can be accessed anytime, anywhere.
summary
Simply put, BI tools are tools that aggregate, analyze, and visualize the various data that companies have, and support them when making decisions in important situations such as management and sales. It plays a role.
The basic functions of BI tools include data collection, processing, analysis, planning, simulation, and reporting.
By introducing BI tools, companies will be able to discover issues and formulate strategies without relying on intuition or experience, and will be able to make quick management decisions through visualization.
BI tools are essential for companies to achieve data-driven and stable management. There are many BI tools on the market, so choose the one that suits your company’s purpose, scale, and budget, and start using it.