

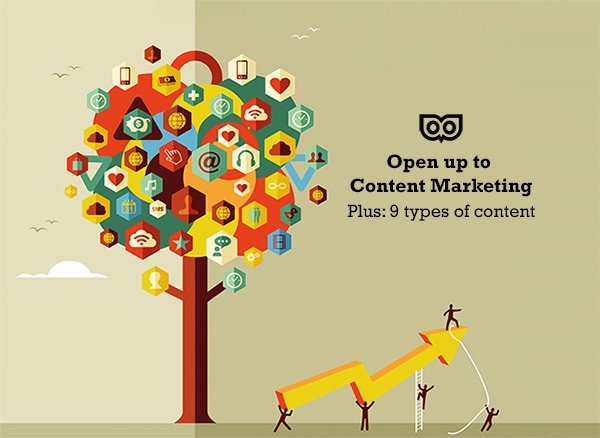
When doing
content marketing
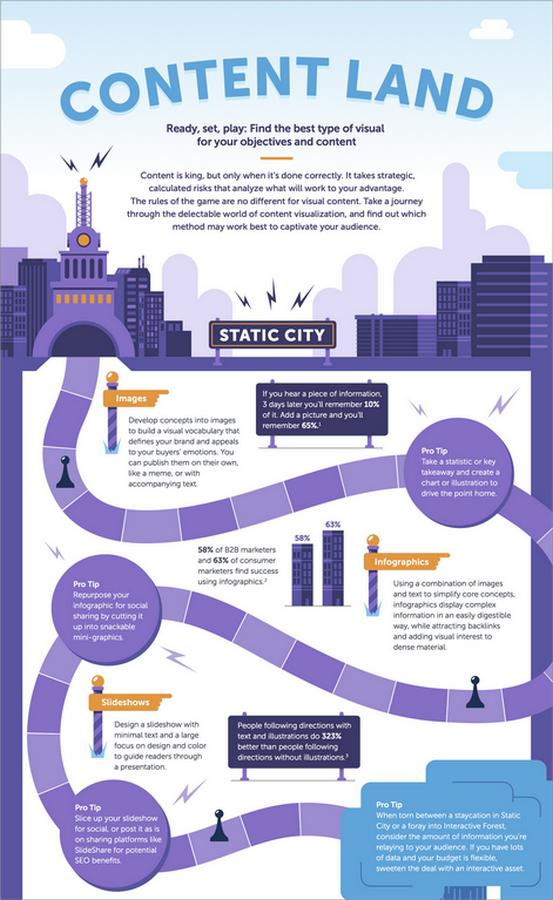
on the internet, focus on infographics. You can create content that conveys your intentions more clearly and is more likely to produce results.
In this article, we will explain the types of “infographics” and usage examples in an easy-to-understand manner.

Related materials:
What exactly is an infographic?
Some people may not be familiar with the term infographic. First, we will explain the basics of what infographics are and why they are necessary for content marketing.

Road signs are a typical example. Even if you put up a sign on the road that says, “The speed limit here is 60km/h,” a speeding driver might not be able to read it. Therefore, by installing a road sign that says “60”, drivers can instantly know that the speed limit here is 60km/h.
In addition, railway route maps and maps can also be considered a type of infographic.

Types of infographics and usage examples
So what kind of infographics are there? We will introduce its types and usage examples.
For example, if you see a pictogram like the one shown above at the entrance to a restroom, you can easily tell that it is a restroom.
Furthermore, you can tell that the men’s toilet is on the left by the illustration of a person wearing pants drawn in blue, and the women’s toilet is on the right by the illustration of a person wearing a skirt drawn in red.
In this way, by using symbols and illustrations that symbolize what you want to convey, it is possible to convey information instantly.

What impression would you get if you saw a homepage with illustrations like the one shown above? I think you can imagine that this company is a real estate agent because it has illustrations of people looking for a house.
By combining an illustration of a house and an illustration of a magnifying glass, you can create a diagram that reminds you of a real estate agent.
For example, “In 2010, the smartphone penetration rate was only 9.7%, but in the following year, 29.3%, in 2015, 62.5%, and in 2015, it reached 71.8%. Let’s say there is news that says, “The market has increased by 7 times.”
It is certainly understandable that the penetration rate of smartphones is increasing, but it is difficult to get a good idea just by reading a text with numbers listed.
By using a graph like this, it becomes easier to visually understand how fast the smartphone penetration rate is growing, and how rapidly it is growing, making it more persuasive.

Therefore, by coloring in the location of Gifu Prefecture on the map like this, you can immediately see where Gifu Prefecture is located in the Japanese archipelago. You can also visualize the location and distance from Tokyo.
Indeed, if we consider the example of the road sign mentioned at the beginning, it can instantly convey the message, “The speed limit here is 60km/h.” You can also feel messages such as “Please drive within the speed limit,” “Don’t speed too much,” and “If you exceed this speed, you will be arrested by the police.”
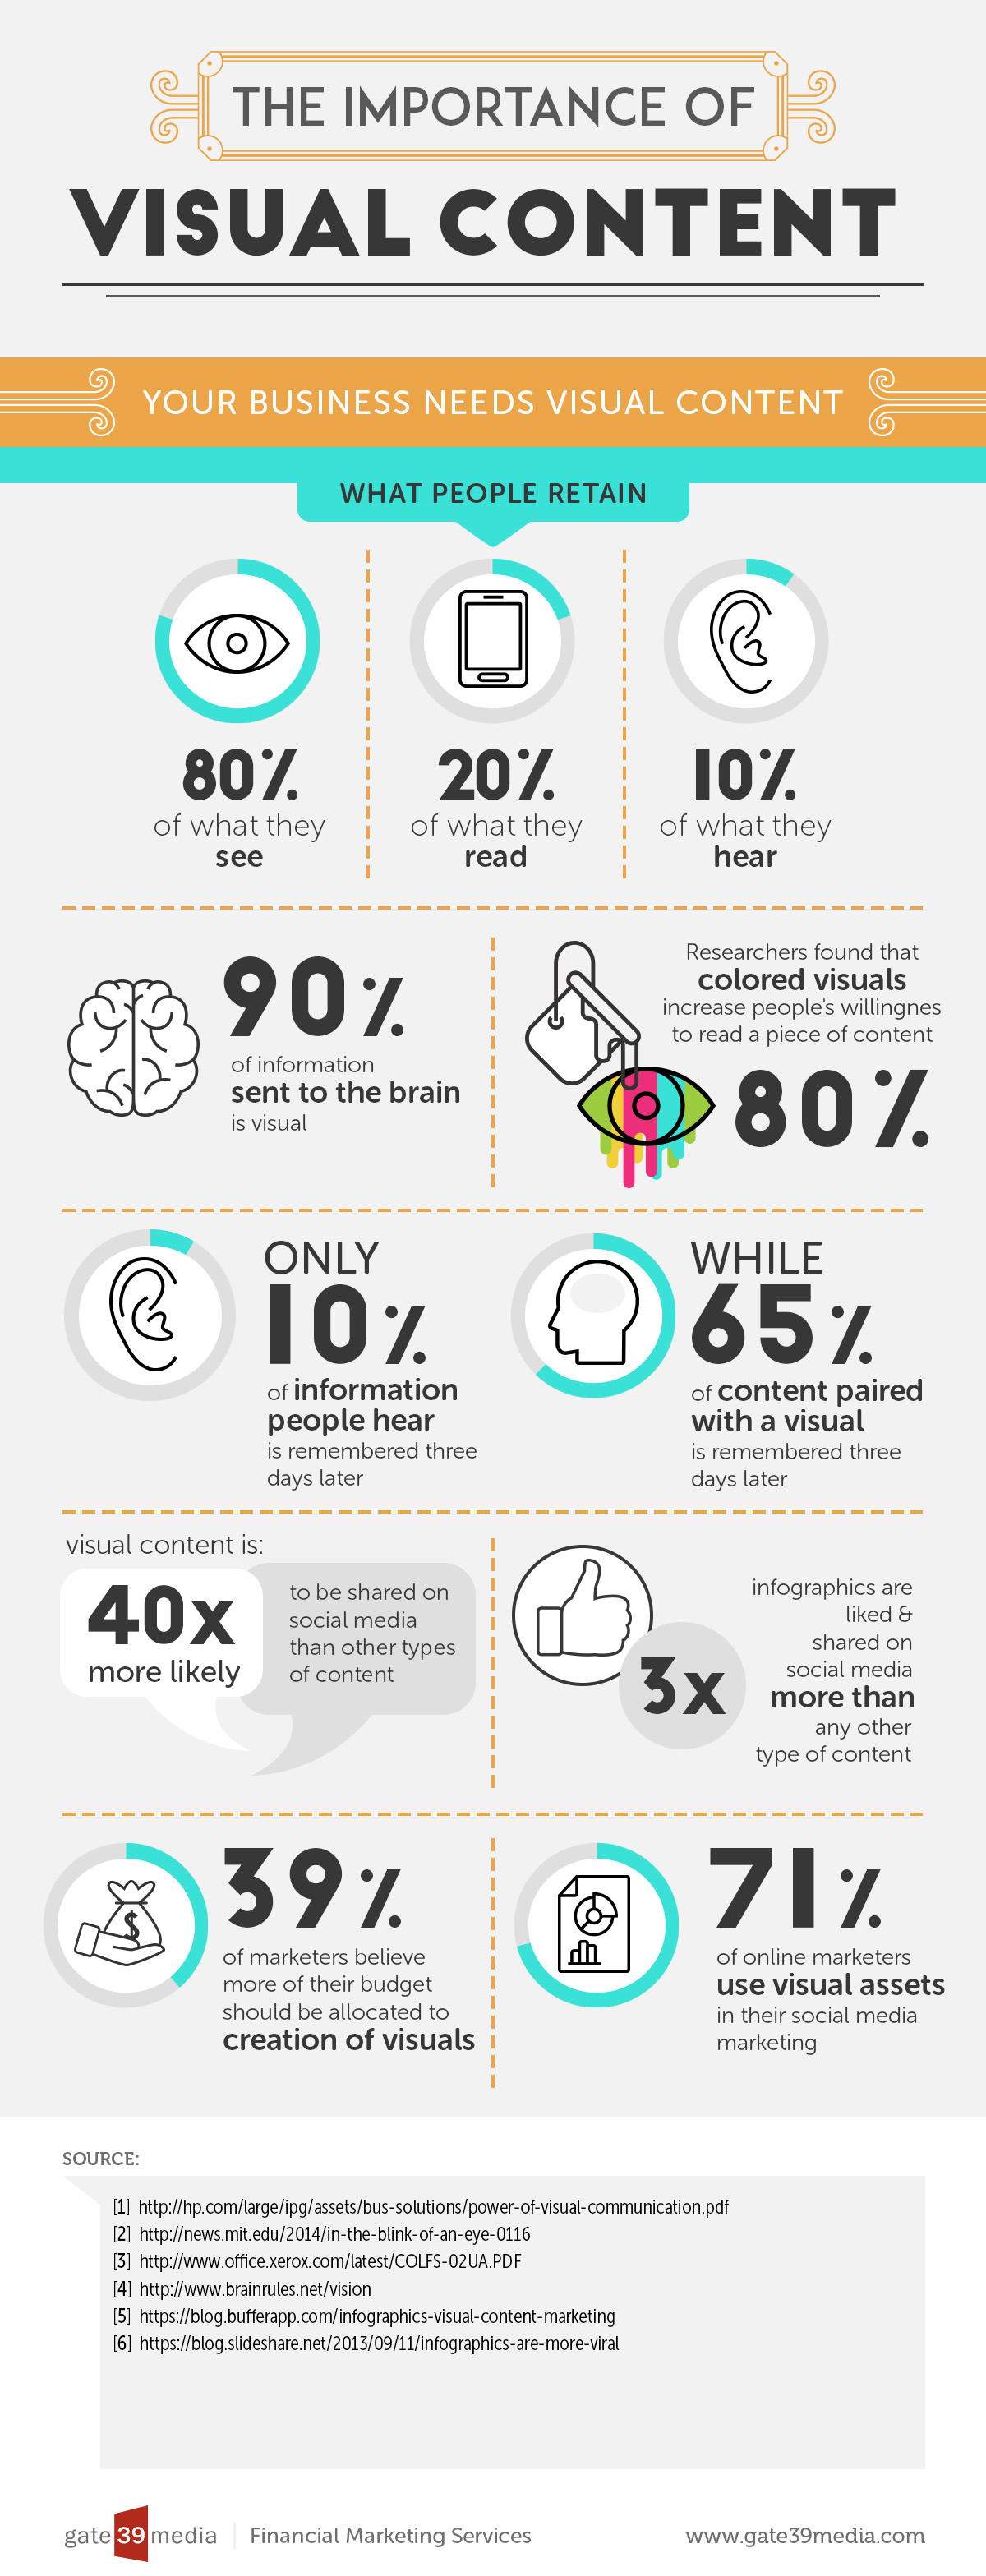
Text can convey information, but it has its limits. If you want to convey more information to people, there is no reason not to use infographics.

summary

◆Infographics are a method of conveying information and data in an easy-to-understand manner using illustrations, charts, etc.
◆Infographics are used everywhere, not only on the Internet, but also on signs, maps, billboards, etc.
◆There are various methods such as pictograms, diagrams, charts, and maps, and when used appropriately, it is possible to convey a lot of information accurately.
◆The amount of information in images is more than 6 times that of text. When used effectively in content marketing, it can lead to better results.