

Modern business situations require the use of various tools. One tool that I would like to draw your attention to is Google Data Portal. Google Data Portal has very low hurdles to introduction, yet it is characterized by its multifunctionality.
In this article, we will explain the overview, features, and basic usage of Google Data Portal, as well as some convenient ways to use it. Beginners who want to use it from now on should also refer to it.
What is Google Data Portal?
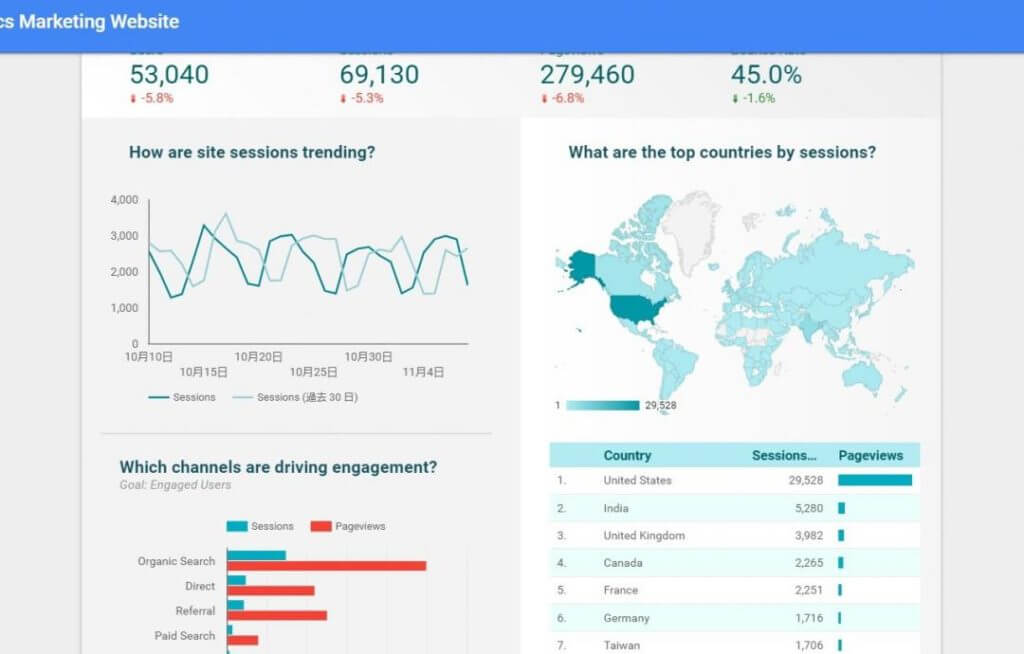
Google Data Portal is a report creation service using
a dashboard
provided by Google for free. It was previously also known as Google Data Studio, but the name changed in May 2021.
Google Data Portal can be connected to over 450 types of connectors, including Google Analytics, Google Ads, and Google Sheets. You can collect data from various services and compile it into reports and other materials.
In addition to Google services, it is also possible to create reports on SNS such as Twitter, Instagram, and Facebook by linking with Google Data Portal.
Features of Google Data Studio
Google Data Portal is a service that specializes in reporting functions. It is a particularly recommended service as it will be familiar to people who regularly use tools provided by Google.
Next, we will explain the features of Google Data Portal in detail.
Easy to use dashboard
The first feature of Google Data Portal is that the dashboard is easy to use. Similar services exist both domestically and internationally, but all functions of Google Data Portal can basically be used for free.
Of course, just because it’s free doesn’t mean it’s not fully functional. It can be used stably in the
cloud
environment provided by Google, and functions such as data loading, visualization, and sharing can be used with high quality.
Easy to collaborate with DMP
Google Data Portal can easily connect to cloud databases specialized for handling big data, such as BigQuery and Redshift, and does not require complicated settings. Maintenance and other tasks can be completed within the Google Data Portal management screen.
If you have a DMP that combines not only data from third-party tools but also your own data such as core data and
CRM
data, you can visualize that data to facilitate decision-making and accelerate business progress.
Can connect to data source
To create a report in Google Data Studio, you use a feature called a connector to get the data you need. Google Data Studio provides many connectors that are very useful.
Supports a variety of data sources, including not only Google tools such as Google Analytics, Google Ads, Search Console, and BigQuery, but also proprietary databases and data uploads such as MySQL and PostgreSQL. is.
Efficient and allows for collaborative editing
One of the features of Google Data Studio is that multiple users can edit together.
Google Data Portal is completely cloud-based, so all you need is a web browser to use it. If you have used Google Sheets or Google Docs, it will be easier to imagine how to use it.
You can specify which Google accounts can view each report, and you can easily control usage privileges such as “editable” and “view only”. You can also freely share reports and perform collaborative editing.

3 basic steps to use Google Data Portal
Anyone can easily use Google Data Studio. Next, we will introduce the basic usage of Google Data Portal in three steps.
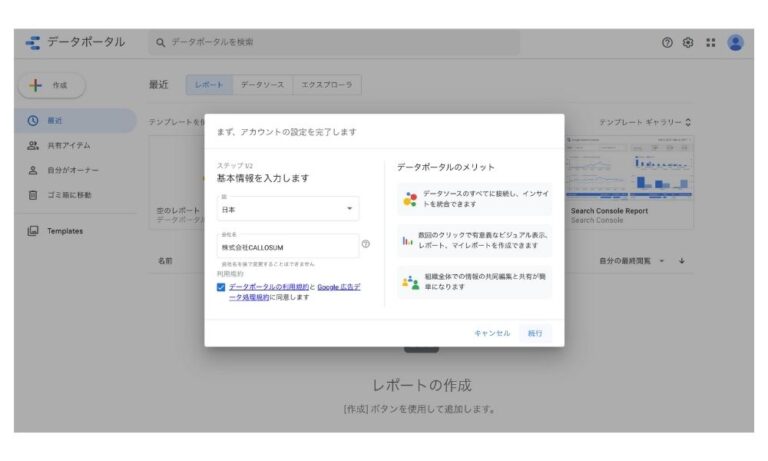
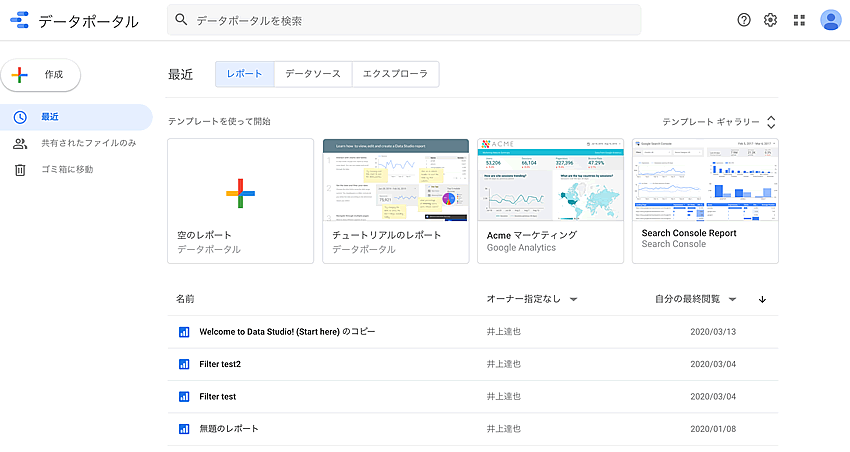
1. Log in to the data portal
First, let’s log in to the data portal. Access the official website and click on “Use for free” at the top right of the screen to open the Data Portal dashboard. The initial preparation is now complete.
2.Connection with data
Next, connect the data. Let’s create a data source to retrieve the data used in the report. Click the Create button at the top left of the dashboard and select your data source.
This will display a list of connectors provided by Google Data Studio. Choose the one that best suits the source of the data you will use for your report.
Then select the desired
account
properties view. Don’t forget to change the name of the connector. The connector you create will be reused in other reports, so we recommend giving it a name that is easy to understand.
If there are no problems with the settings, click “Connect” to connect to the data provider. A list of fields included in the data source will be displayed, so if there are no problems, move to the report creation screen by clicking “Create Report”.
3. Create and share reports
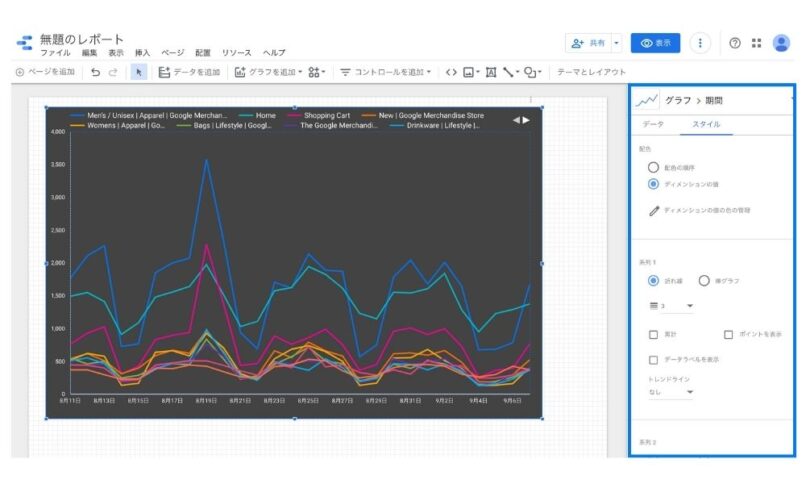
When you move to the report creation screen, a blank page is initially displayed. Try selecting a graph in the format you like from “Add Graph” and placing it anywhere on the page.
When you install a graph, detailed graph settings will be displayed on the right side of the screen, and you can change data-related settings, style-related settings, etc. In addition to graphs, you can also set filters and images on the report.
Try using various functions to create easy-to-understand reports. Please note that you can share the created report from the share menu at the top right of the screen.
Convenient ways to use Google Data Portal
So far, we have introduced the basic ways to use Google Data Portal, but there are many more useful ways to use Google Data Portal. So let’s continue checking out some useful ways to use Google Data Portal.
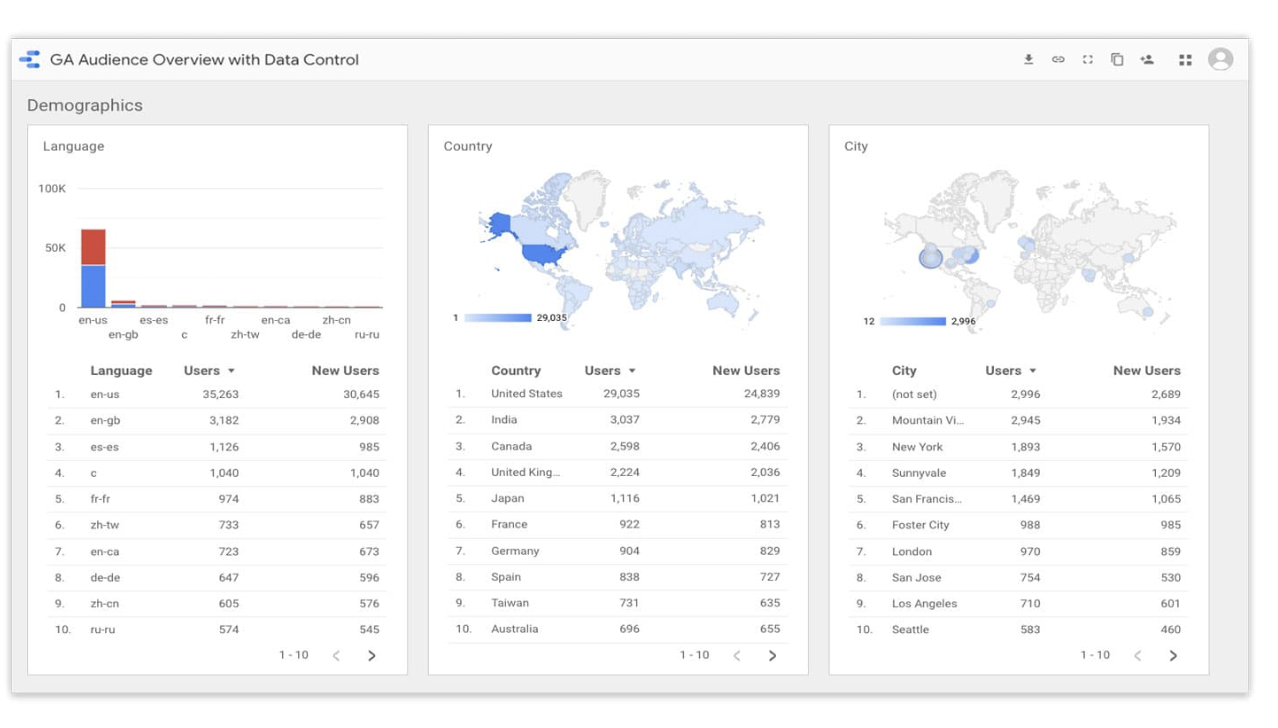
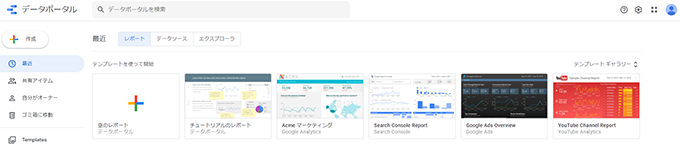
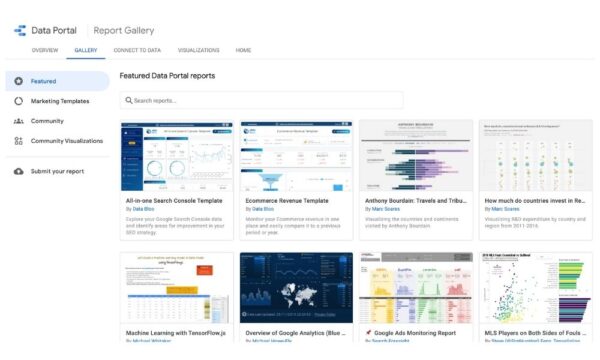
Utilize templates
Some people who are new to Google Data Studio may be reluctant to create reports from scratch. In such a case, try using the template gallery on the top page.
The template gallery has a wide selection of report templates for tools such as Search Console and Google Ads. If you want to quickly complete a report, please try using a template.
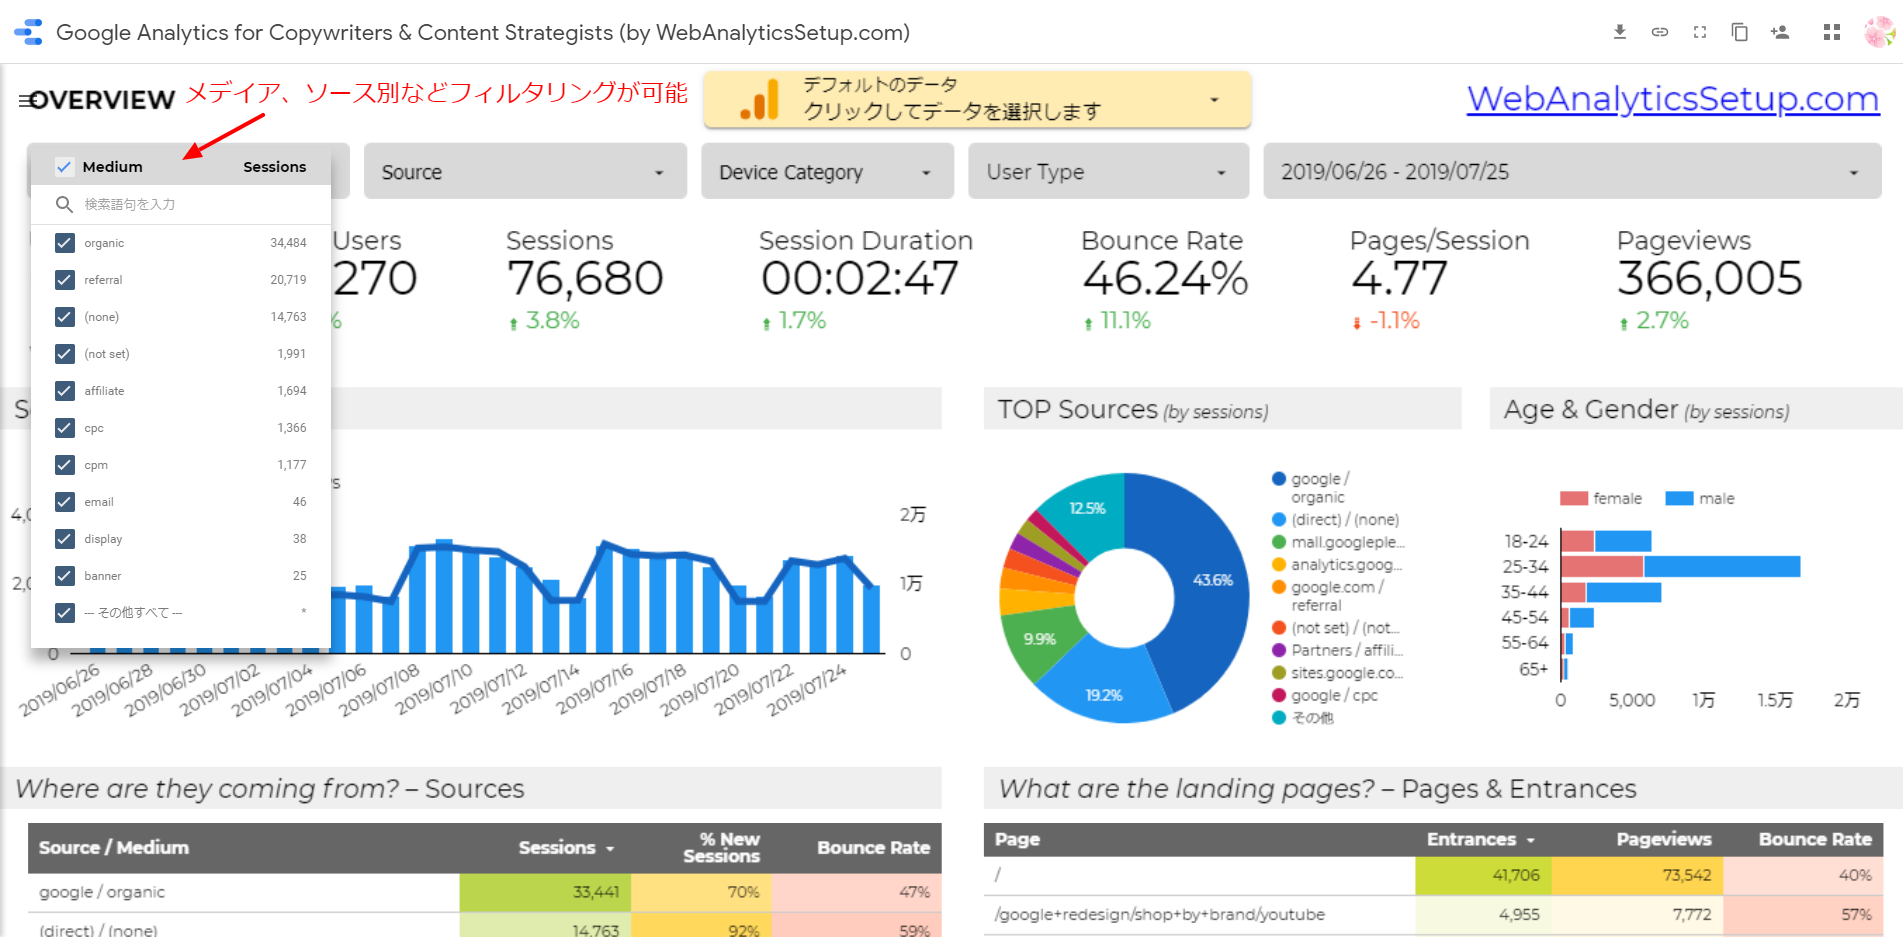
Filter settings
When creating a report, you may want to display only data that meets certain conditions. In such a case, try using the filter function.
First, select “Add Filter” at the bottom of the data bar on the right side of the screen. Next, on the filter creation screen, set the filter name and filter conditions and save. This allows you to easily narrow down your data.
Once you create a filter, it can be applied to other tables and charts using the same data source. This is a useful feature, so please keep it in mind.
Report period settings
When multiple tables or graphs are displayed in a report, it can be very tedious to set the analysis period for each one individually, but Google Data Studio has a function that allows you to set the period for all tables and graphs.
First, select “Add Control” from the top menu bar of the report editing screen, and then select “Period Settings”. Next, click anywhere in the report to display an area where you can select a period from the dropdown.
In the period properties, you can choose between the default automatic period or a custom period.
Integration with spreadsheets
Google Data Studio allows you to create reports not only for services such as Google Analytics and Search Console. By linking Google Sheets as a data source, you can easily create reports on any data using Google Data Portal.
However, when using a spreadsheet as a data source, please note that there are rules for input methods.
To actually add a spreadsheet as a data source, first select “Google Spreadsheet” from the “Add data” bar at the top of the report creation screen. Then, enter the spreadsheet URL, select the target sheet, and add it.
Frequently asked questions about Google Data Studio
Finally, we will summarize some frequently asked questions about Google Data Portal. If you have trouble using Google Data Portal, please refer to it.
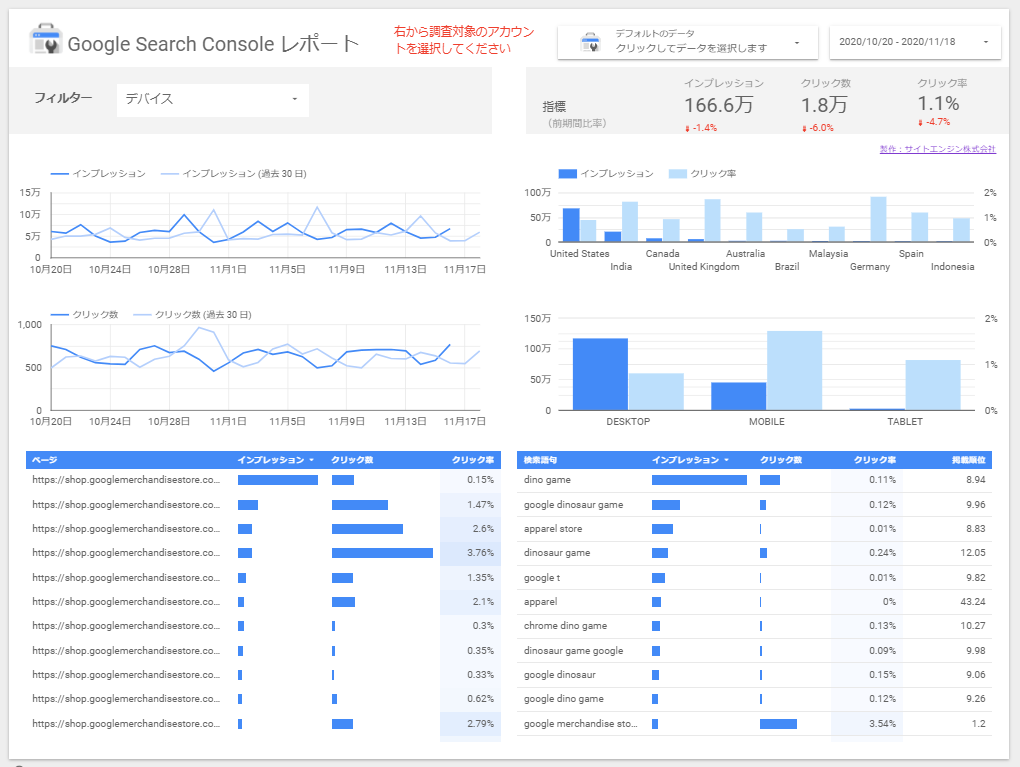
What if I can’t confirm my search query?
Basically, if you link Analytics and Search Console data, you can check user search keywords on Analytics.
However, if you use the search query dimension on the Analytics data source, it will be difficult to confirm the search keyword because “(not set)” is often displayed.
To check search keywords in Google Data Portal, you need to connect the Search Console data source in addition to Analytics. Please select Search Console from “Add data” in the upper left menu bar.
What if there is a discrepancy in the numbers with analytics?
If the numbers in Google Analytics and Data Studio are different, please check the data collection period and whether different segments or filters have been applied.
summary
By using Google Data Portal, you can turn a variety of data into easy-to-understand reports. It has many unique features that other services don’t have, and it’s not that difficult to use.
Google Data Studio has many useful features. Please try using Google Data Portal and find it useful for your web marketing activities.